python 画图-标注点,画虚线
转载
import matplotlib.pyplot as plt
import numpy as np
# 函数图
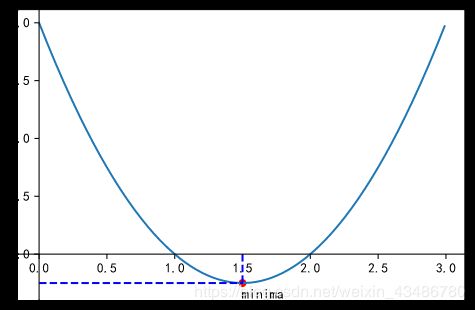
x = np.arange(0, 3, 0.01)
y = x ** 2 - 3 * x + 2
plt.plot(x, y)
plt.scatter([1.5],[-0.25],s=25,c='r') # 标注最小值
# 点的标签(座标中加减的 `0.15` 是显示位置的偏移,避免挡住点)
plt.text(1.5+0.15, -0.25-0.15, 'minima', ha='center', va='bottom', fontsize=10.5) # horizontal alignment
# 画两条虚线
plt.plot([0, 1.5], [-0.25, -0.25], c='b', linestyle='--')
plt.plot([1.5, 1.5], [0, -0.25], c='b', linestyle='--')
# 座标轴调位
ax = plt.gca()
# 移到原点
ax.xaxis.set_ticks_position('bottom')
ax.yaxis.set_ticks_position('left')
ax.spines['bottom'].set_position(('data', 0))
ax.spines['left'].set_position(('data', 0))