pyqt5 matplotlib 收集 记录 LTS
Matplotlib: Visualization with Python
官网
https://matplotlib.org/#
Matplotlib 中文网
https://www.matplotlib.org.cn/
pyqt5 官方例子:
https://matplotlib.org/gallery/user_interfaces/embedding_in_qt_sgskip.html#sphx-glr-gallery-user-interfaces-embedding-in-qt-sgskip-py
用户说明
https://matplotlib.org/users/index.html
官方教程
https://matplotlib.org/tutorials/index.html
参考教程
https://matplotlib.org/resources/index.html
numpy 中文网
https://www.numpy.org.cn/
Pandas中文网
https://www.pypandas.cn/
matplotlib API:
https://matplotlib.org/api/index.html#toolkits
https://matplotlib.org/api/pyplot_summary.html
https://matplotlib.org/api/_as_gen/matplotlib.pyplot.xlim.html#matplotlib.pyplot.xlim


Matplotlib is a comprehensive library for creating static, animated, and interactive visualizations in Python.
《PYTHON数据可视化编程实战》:matplot的内容(不包括嵌入到pyqt5)相当一部分的问题都是参考这里的内容。
2.《Python科学计算(第二版)》:numpy和分形的相关知识主要参考了这里。相较于第一版语言上更加简洁,内容上更加丰富,清晰详细的例程,csdn上都有下载。另外数学不太好的同学(比如我)也可以多研究一下里面的例程。
matplotlib for python developers
可能是pyqt4的
看了matplotlib for python developers这本书,基本掌握了在pyqt中显示曲线的做法,于是自己写一个。
https://blog.csdn.net/weixin_30480583/article/details/99464690
Create
Develop publication quality plots with just a few lines of code
Use interactive figures that can zoom, pan, update…
测试 学习 环境
如何 原点 从0开始
import matplotlib.pyplot as plt
import numpy as np

bottom, top = plt.ylim()
plt.ylim(0, top)
left, right = plt.xlim()
plt.xlim(0, right)
print('bottom, top', bottom, top)
print('left, right', left, right)
ax = plt.gca()
ax.xaxis.set_ticks_position('bottom')
ax.spines['bottom'].set_position(('data',0))
ax.yaxis.set_ticks_position('left')
ax.spines['left'].set_position(('data',0))
python plt画图横纵坐标0点重合
https://blog.csdn.net/weixin_30657541/article/details/99901342
matplot画图坐标原点不重合的问题
https://blog.csdn.net/weixin_40240670/article/details/80655537
如何显示网格线
plt.grid()
PYthon——plt.scatter各参数详解
https://blog.csdn.net/qiu931110/article/details/68130199/
有散点图 各种示例
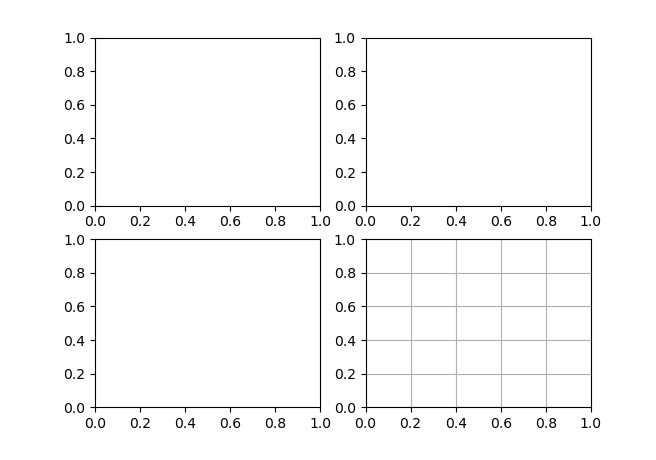
如何显示多个坐标图
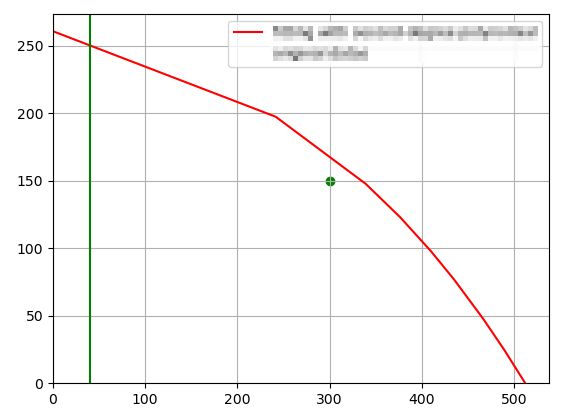
如何额外添加 辅助线 和点
plt.axvline(x=40, ls="-", c="green")#添加垂直直线
plt.scatter(300, 150, c="green", label='operating point')
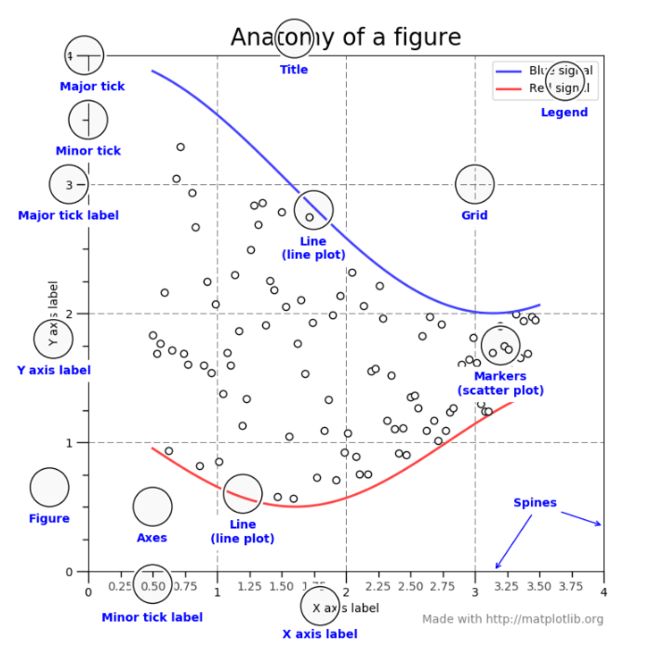
坐标图组成部分 :
https://matplotlib.org/tutorials/introductory/usage.html#sphx-glr-tutorials-introductory-usage-py
动态绘制曲线
一个坐标图中 显示 多条曲线
例子1
https://blog.csdn.net/qq_39105012/article/details/88584124
import matplotlib
# 使用 matplotlib中的FigureCanvas (在使用 Qt5 Backends中 FigureCanvas继承自QtWidgets.QWidget)
from matplotlib.backends.backend_qt5agg import FigureCanvasQTAgg as FigureCanvas
from PyQt5 import QtCore, QtWidgets, QtGui
from PyQt5.QtWidgets import QDialog, QPushButton, QVBoxLayout
import matplotlib.pyplot as plt
import numpy as np
import sys


class Main_window(QDialog):
    def __init__(self):
        super().__init__()

        # 几个QWidgets
        self.figure = plt.figure(facecolor='#FFD7C4') #可选参数,facecolor为背景颜色
        self.canvas = FigureCanvas(self.figure)
        self.button_draw = QPushButton("绘图")

        # 连接事件
        self.button_draw.clicked.connect(self.Draw)

        # 设置布局
        layout = QVBoxLayout()
        layout.addWidget(self.canvas)
        layout.addWidget(self.button_draw)
        self.setLayout(layout)

    def Draw(self):
        AgeList = ['10', '21', '12', '14', '25']
        NameList = ['Tom', 'Jon', 'Alice', 'Mike', 'Mary']

        #将AgeList中的数据转化为int类型
        AgeList = list(map(int, AgeList))

        # 将x,y轴转化为矩阵式
        self.x = np.arange(len(NameList)) + 1
        self.y = np.array(AgeList)

        #tick_label后边跟x轴上的值,(可选选项:color后面跟柱型的颜色,width后边跟柱体的宽度)
        plt.bar(range(len(NameList)), AgeList, tick_label=NameList, color='green', width=0.5)

        # 在柱体上显示数据
        for a, b in zip(self.x, self.y):
            plt.text(a-1, b, '%d' % b, ha='center', va='bottom')

        #设置标题
        plt.title("Demo")

		#画图
        self.canvas.draw()
        # 保存画出来的图片
        plt.savefig('1.jpg')


# 运行程序
if __name__ == '__main__':
    app = QtWidgets.QApplication(sys.argv)
    main_window = Main_window()
    main_window.show()
    app.exec()
python matplotlib绘制gif动图以及保存
https://blog.csdn.net/qq_28888837/article/details/85778395
理解matplotlib绘图
https://www.cnblogs.com/yxzfscg/p/4972257.html
Matplotlib pyplot嵌入PYQT5的实战与反思
https://blog.csdn.net/qq_31809257/article/details/89292824
