pyqt5 pyqtgraph 收集 记录 LTS
pyqt5 pyqtgraph 收集 记录 LTS
参考资料:
Python GUI教程(十三):在GUI中使用pyqtgraph绘图库
https://zmister.com/archives/187.html
http://www.pyqtgraph.org/
https://doc-snapshots.qt.io/4.8/graphicsview.html
https://numpy.org/
https://pyqtgraph.readthedocs.io/en/latest/
https://github.com/pyqtgraph/pyqtgraph-core.git
https://github.com/pyqtgraph/pyqtgraph
https://doc.qt.io/archives/qt-4.8/graphicsview.html#the-graphics-view-coordinate-system
https://pyqtgraph.readthedocs.io/en/latest/qtcrashcourse.html
《快速掌握PyQt5》第三十六章 用PyQtGraph绘制可视化数据图表
https://blog.csdn.net/La_vie_est_belle/article/details/90057945
pyqtgraph 的API
http://www.pyqtgraph.org/pyqtgraph/documentation/build/html/apireference.html
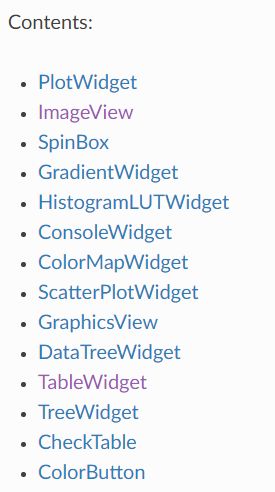
pyqtgraph 中包含的qt控件
https://pyqtgraph.readthedocs.io/en/latest/widgets/index.html
https://pyqtgraph.readthedocs.io/en/latest/_modules/pyqtgraph/graphicsItems/ViewBox/ViewBox.html#ViewBox.setMouseEnabled
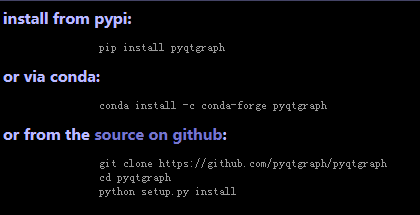

install from pypi:
                pip install pyqtgraph
or via conda:
                conda install -c conda-forge pyqtgraph
or from the source on github:
                git clone https://github.com/pyqtgraph/pyqtgraph
                cd pyqtgraph
                python setup.py install

python -m pyqtgraph.examples
对比
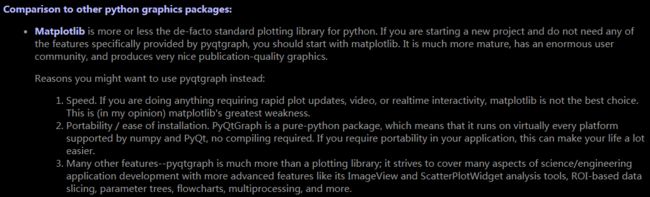
matplotlib:对于绘图而言,pyqtgraph几乎不像matplotlib完整或者成熟,但运行速度更快。 Matplotlib的目标更多是制作出版质量的图形,而pyqtgraph则用于数据采集和分析应用。Matplotlib对于matlab程序员来说更直观。pyqtgraph对python/qt程序员更直观。Matplotlib(据我所知)并不包含许多pyqtgraph的功能,如图像交互,体绘制,参数树,流程图等。
OpenGL:一个功能强大的二维三维专业图形绘制工具;
Matplotlib:Python中很经典的图形绘制模块;
PyQtGraph:基于Qt平台,提供交互的数据显示图形绘制。
PyQtGraph用于图形绘制有很多的优势:
拥有丰富的图形种类;
能够快速地实时更新绘图数据;
能够进行交互式的操作;
多种标记功能;
……
PyQtGraph的安装很简单,使用pip就可以直接安装:
pip install pyqtgraph
import pyqtgraph as pg
python -m pyqtgraph.examples
这样,PyQtGraph的图形作为一个窗口部件集成到了选项卡中。
PyQtGraph的用法和功能还有很多,大家可以在自带的示例库,官方文档(http://www.pyqtgraph.org/documentation/index.html),github中(https://github.com/pyqtgraph/pyqtgraph)获取到最新最全的使用方法和技巧。
https://pyqtgraph.readthedocs.io/en/latest/index.html
GraphicsView框架及numpy计算库的有机结合,造就了PyQtGraph库的高速绘制性能,小伙伴们,快试下吧。
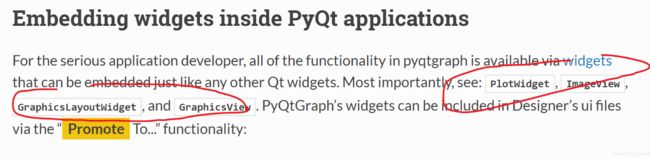
Promote
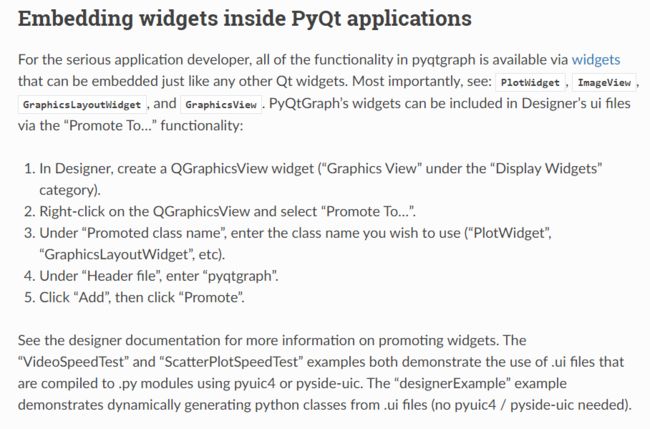
对于认真的应用程序开发人员来说,pyqtgraph中的所有功能都可以通过像其他任何Qt小部件一样嵌入来使用。 更多的重要信息,请参阅:lotWidget,ImageView,GraphicsLayoutWidget和GraphicsView。 PyQtGraph的小部件可以通过“Promote To …”功能包含在Designer的ui文件中:
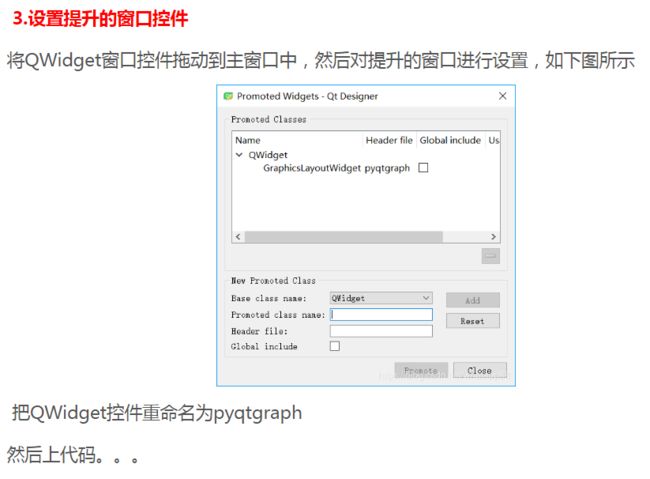
Designer中,创建一个QGraphicsView小部件(“Graphics View”类别下的“Display Widgets”)。
用鼠标右键单击QGraphicsView并选择““Promote To…”。
在“Promoted calss name”下,输入您希望使用的类名称(“PlotWidget”,“GraphicsLayoutWidget”等)。
在“Header file”下,输入“pyqtgraph”。
点击“Add”,然后点击“Promote”。
有关promoting widgets的更多信息,请参阅设计器文档。“VideoSpeedTest”和“ScatterPlotSpeedTest”示例都演示了如何使用pyui4或pyside-uic编译为.py模块的.ui文件。“designerExample”示例演示从.ui文件动态生成python类(不需要pyuic4 / pyside-uic)。
————————————————
版权声明:本文为CSDN博主「Suffering-」的原创文章,遵循CC 4.0 BY-SA版权协议,转载请附上原文出处链接及本声明。
原文链接:https://blog.csdn.net/Eppley/article/details/82999998
pyqtgraph中文文档
https://blog.csdn.net/Eppley/article/details/82999998
参考例子 :
pyqtgraph+Qt Designer应用
https://blog.csdn.net/weixin_43417472/article/details/89356461
pyqt之QGraphics系列----节点编辑器(一)
https://www.jianshu.com/p/5c833061d0c0
使用pyqtgraph模块进行PyQt绘图(2)
https://blog.csdn.net/qiushangz/article/details/97943697
https://gitee.com/tqtrade/PyQt/blob/master/PyQtGraph/tools.py
Python交互K线工具 K线核心功能+指标切换
https://www.cnblogs.com/ft-Pavilion/p/8948391.html
https://github.com/aiqtt
【PyQt5】使用pyqtgraph绘图时UI卡顿的解决
https://www.wandouip.com/t5i409105/
思路是把所有数据处理计算的过程放在主线程之外的子线程内
问题,如果不对数据进行剪裁,长时间过后主线程内的绘图会消耗比较多的时间
from PyQt5.QtWidgets import *
from PyQt5.QtCore import *
from PyQt5.QtGui import *
from PyQt5 import QtWidgets,QtGui,QtCore
import pyqtgraph as pg
import sys,os,random,time,psutil

class UI_MainWindow(QMainWindow):
    def __init__(self):
        super(UI_MainWindow, self).__init__()
        self.setWindowTitle('CPUinfo')
        self.setWindowIcon(QIcon('./CPU.png'))
        self.resize(600,480)

        self.main_widget = QWidget()
        self.main_layout = QGridLayout()
        self.main_widget.setLayout(self.main_layout)
        self.setCentralWidget(self.main_widget)
        self.plot_widget = QWidget()
        self.plot_layout = QGridLayout()
        self.plot_widget.setLayout(self.plot_layout)

        self.plot_plt = pg.PlotWidget()
        self.plot_plt.setYRange(max=100,min=0)
        self.plot_layout.addWidget(self.plot_plt)
        self.plot_plt.setYRange(max=100,min=0)

        self.main_layout.addWidget(self.plot_widget)

        self.setCentralWidget(self.main_widget)

class NewThread(QThread):
    trigger = pyqtSignal(list)
    def __init__(self):
        super(NewThread, self).__init__()
        self.dataList = []

    def run(self):
        print('NewThread start!')
        timelist = []
        while True:
            time.sleep(1)
            # Xtime = time.strftime("%H%M%S")
            Ycpu = "%0.2f" % psutil.cpu_percent(interval=1)
            self.dataList.append(float(Ycpu))
            # timelist.append(float(Xtime))
            # print(Xtime, Ycpu)
            self.trigger.emit(self.dataList)


class showMainWindow(UI_MainWindow):
    def __init__(self):
        super(showMainWindow, self).__init__()
        self.Thread1 = NewThread()
        self.Thread1.trigger.connect(self.Plot)

        self.Thread1.start()

    def Plot(self,list1):
        self.plot_plt.plot().setData(list1)

if __name__ == '__main__':
    app = QApplication(sys.argv)
    gui = showMainWindow()
    gui.show()
    sys.exit(app.exec_())
鼠标
1
class MyImageView(pyqtgraph.ImageView):
    def wheelEvent(self, event):
        event.accept()

    # you can do the same with other mouse events, if that's your issue too
    def mousePressEvent(self, event):
        event.accept()

class YourWidget(QtWidgets.QWidget):
    def __init__(self, *args, **kwargs):
        QtWidgets.QWidget.__init__(self, *args, **kwargs)
        [...]
        im1 = MyImageView()
2
# Tree
self.tree_widget = QtWidgets.QTreeWidget()
self.tree_widget.setHeaderLabels(["Key", "Value", "Image"])
root_item = QtWidgets.QTreeWidgetItem(["Test Item"])
self.tree_widget.addTopLevelItem(root_item)

# Data
val=numpy.random.normal(size=(32, 24, 3))

# Sub-widgets
tableWidget = pyqtgraph.TableWidget(sortable=False)
tableWidget.setData(val)

im1 = pyqtgraph.ImageView()
im1.setImage(val.T)

self.tree_widget.setItemWidget(root_item, 1, tableWidget)
self.tree_widget.setItemWidget(root_item, 2, im1)
dock area
PyQt开发中pyqtgraph绘图库的DockArea停靠窗容器和Dock停靠窗怎样设置初始大小?
from pyqtgraph.dockarea import *

area = DockArea()
dock = Dock("Dock1", size=(500, 400))
area.addDock(dock, 'top')
area.setFixedWidth(800)
# area.setFixedHeight(600)
# area.setFixedSize(800, 600)
# area.setMinimumSize(600, 400)
# area.setMaximumHeight(600)
Zoom only in x or y direction in pyqtgraph using mouse
https://stackoverflow.com/questions/56143505/zoom-only-in-x-or-y-direction-in-pyqtgraph-using-mouse
You can use setMouseEnabled(). From the documentation:
setMouseEnabled(x=None, y=None)
Set whether each axis is enabled for mouse interaction. x, y arguments must be True or False. This allows the user to pan/scale one axis of the view while leaving the other axis unchanged.
For example
import pyqtgraph as pg
plot_widget = pg.PlotWidget()
plot_widget.plotItem.setMouseEnabled(y=False) # Only allow zoom in X-axis
plot_widget.plotItem.setMouseEnabled(x=False) # Only allow zoom in Y-axis
Only X-axis (left), Only Y-axis (right)
111
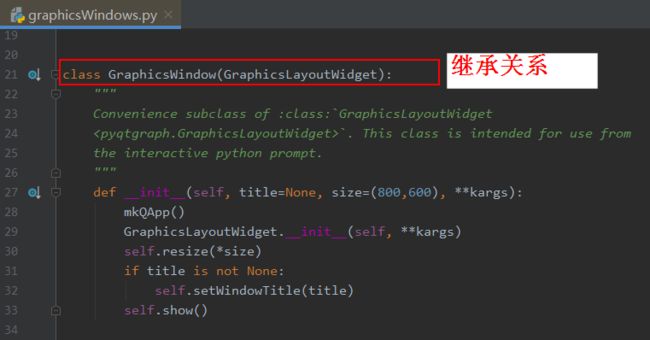
class GraphicsWindow(GraphicsLayoutWidget):
    """
    Convenience subclass of :class:`GraphicsLayoutWidget
    <pyqtgraph.GraphicsLayoutWidget>`. This class is intended for use from
    the interactive python prompt.
    """
    def __init__(self, title=None, size=(800,600), **kargs):
        mkQApp()
        GraphicsLayoutWidget.__init__(self, **kargs)
        self.resize(*size)
        if title is not None:
            self.setWindowTitle(title)
        self.show()
恢复原来的坐标轴比例