k8s三部曲(3)——监控部署prometheus+grafana
参考文章
-
版权声明:本文为CSDN博主「common_util」的原创文章,遵循 CC 4.0 BY-SA
版权协议,转载请附上原文出处链接及本声明。
原文链接:https://blog.csdn.net/shenhonglei1234/article/details/80827570 -
作者:amdaous
链接:https://www.jianshu.com/p/ac8853927528
来源:简书 著作权归作者所有。商业转载请联系作者获得授权,非商业转载请注明出处。
背景
-
Prometheus介绍
Prometheus(普罗米修斯)是一套开源的监控&报警&时间序列数据库的组合,起始是由SoundCloud公司开发的。随着发展,越来越多公司和组织接受采用Prometheus,社会也十分活跃,他们便将它独立成开源项目,并且有公司来运作。Google
SRE的书内也曾提到跟他们BorgMon监控系统相似的实现是Prometheus。现在最常见的Kubernetes容器管理系统中,通常会搭配Prometheus进行监控。
Prometheus基本原理是通过HTTP协议周期性抓取被监控组件的状态,这样做的好处是任意组件只要提供HTTP接口就可以接入监控系统,不需要任何SDK或者其他的集成过程。这样做非常适合虚拟化环境比如VM或者Docker
。 Prometheus应该是为数不多的适合Docker、Mesos、Kubernetes环境的监控系统之一。
输出被监控组件信息的HTTP接口被叫做exporter
。目前互联网公司常用的组件大部分都有exporter可以直接使用,比如Varnish、Haproxy、Nginx、MySQL、Linux
系统信息 (包括磁盘、内存、CPU、网络等等),具体支持的源看:https://github.com/prometheus。与其他监控系统相比,Prometheus的主要特点是:
1.一个多维数据模型(时间序列由指标名称定义和设置键/值尺寸);
2.非常高效的存储,平均一个采样数据占~3.5bytes左右,320万的时间序列,每30秒采样,保持60天,消耗磁盘大概228G;
3.一种灵活的查询语言;
4.不依赖分布式存储,单个服务器节点;
5.时间集合通过HTTP上的PULL模型进行;
6.通过中间网关支持推送时间;
7.通过服务发现或静态配置发现目标;
8.多种模式的图形和仪表板支持。 -
Grafana介绍
Grafana是一个跨平台的开源的度量分析和可视化工具,可以通过将采集的数据查询然后可视化的展示,并及时通知。它主要有以下六大特点:
1、展示方式:快速灵活的客户端图表,面板插件有许多不同方式的可视化指标和日志,官方库中具有丰富的仪表盘插件,比如热图、折线图、图表等多种展示方式;
2、数据源:Graphite,InfluxDB,OpenTSDB,Prometheus,Elasticsearch,CloudWatch和KairosDB等;
3、通知提醒:以可视方式定义最重要指标的警报规则,Grafana将不断计算并发送通知,在数据达到阈值时通过Slack、PagerDuty等获得通知;
4、混合展示:在同一图表中混合使用不同的数据源,可以基于每个查询指定数据源,甚至自定义数据源;
5、注释:使用来自不同数据源的丰富事件注释图表,将鼠标悬停在事件上会显示完整的事件元数据和标记;
6、过滤器:Ad-hoc过滤器允许动态创建新的键/值过滤器,这些过滤器会自动应用于使用该数据源的所有查询。
搭建NFS服务
-
Master节点安装
yum install -y nfs-utils rpcbind -
其他node安装
yum install -y nfs-utils -
主节点配置
192.168.0.0/24:这个是运行访问NFS的IP范围,也就是192.168.0开头的IP,24是掩码长度。 根据自己的k8s主机网段设置。
(rw,no_root_squash,no_all_squash,sync):
可以设定的参数主要有以下这些:
rw:可读写的权限;
ro:只读的权限;
no_root_squash:登入到NFS主机的用户如果是root,该用户即拥有root权限;
root_squash:登入NFS主机的用户如果是root,该用户权限将被限定为匿名使用者nobody;
all_squash:不管登陆NFS主机的用户是何权限都会被重新设定为匿名使用者nobody。
anonuid:将登入NFS主机的用户都设定成指定的user id,此ID必须存在于/etc/passwd中。
anongid:同anonuid,但是变成group ID就是了!
sync:资料同步写入存储器中。
async:资料会先暂时存放在内存中,不会直接写入硬盘。
insecure:允许从这台机器过来的非授权访问。$ vi /etc/exports /nfs/prometheus/data/ 192.168.0.0/24(insecure,rw,no_root_squash,no_all_squash,sync) /nfs/grafana/data/ 192.168.0.0/24(insecure,rw,no_root_squash,no_all_squash,sync) -
创建相应目录
#exports中的配置的内容,需要创建下/nfs/prometheus/data/
mkdir -p  /nfs/prometheus/data/
#修改权限
chmod -R 777 /nfs/prometheus/data/
#验证配置的/nfs/prometheus/data/是否正确
exportfs -r
#exports中的配置的内容,需要创建下/nfs/grafana/data/ mkdir -p /nfs/grafana/data/ #修改权限 chmod -R 777 /nfs/grafana/data/ #验证配置的/nfs/grafana/data/ 是否正确 exportfs -r -
启动服务
#主节点 systemctl enable nfs systemctl start nfs systemctl status nfs #所有节点 systemctl enable rpcbind systemctl start rpcbind systemctl status rpcbind -
检验
NFS客户端的操作:
1、showmout命令对于NFS的操作和查错有很大的帮助,所以我们先来看一下showmount的用法
showmout
-a :这个参数是一般在NFS SERVER上使用,是用来显示已经mount上本机nfs目录的cline机器。
-e :显示指定的NFS SERVER上export出来的目录。
2、mount nfs目录的方法:
mount -t nfs hostname(orIP):/directory /mount/point$ showmount -e 192.168.0.111 Export list for 192.168.0.111: /nfs/grafana/data 192.168.0.0/24 /nfs/prometheus/data 192.168.0.0/24
安装Prometheus
-
kubernetest集群中创建namespace
#编写namespace.yaml文件
apiVersion: v1
kind: Namespace
metadata:
  name: ns-monitor
  labels:
    name: ns-monitor
kubectl apply -f namespace.yaml -
安装node-exporter
在kubernetest集群中部署node-exporter,Node-exporter用于采集kubernetes集群中各个节点的物理指标,比如:Memory、CPU等。可以直接在每个物理节点是直接安装,这里我们使用DaemonSet部署到每个节点上,使用 hostNetwork: true 和 hostPID: true 使其获得Node的物理指标信息,配置tolerations使其在master节点也启动一个pod
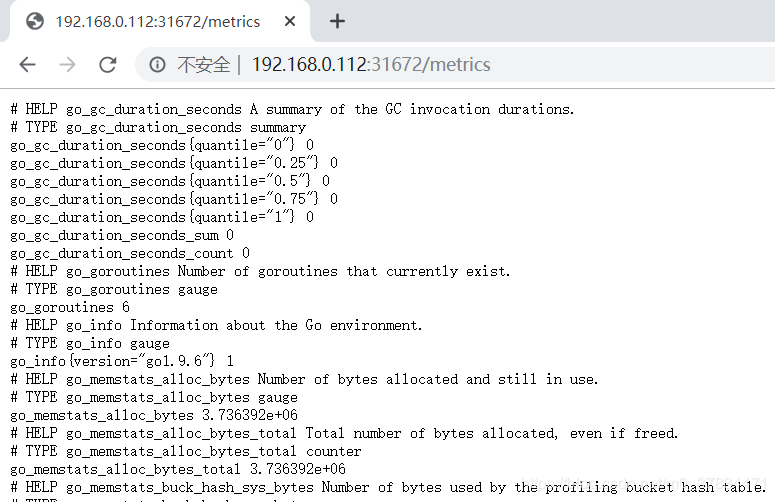
#编写node-exporter.yml
kind: DaemonSet
apiVersion: apps/v1
metadata:
  labels:
    app: node-exporter
  name: node-exporter
  namespace: ns-monitor
spec:
  revisionHistoryLimit: 10
  selector:
    matchLabels:
      app: node-exporter
  template:
    metadata:
      labels:
        app: node-exporter
    spec:
      containers:
        - name: node-exporter
          image: prom/node-exporter:v0.16.0
          ports:
            - containerPort: 9100
              protocol: TCP
              name:	http
      hostNetwork: true
      hostPID: true
      tolerations:
        - effect: NoSchedule
          operator: Exists

---
kind: Service
apiVersion: v1
metadata:
  labels:
    app: node-exporter
  name: node-exporter-service
  namespace: ns-monitor
spec:
  ports:
    - name:	http
      port: 9100
      nodePort: 31672
      protocol: TCP
  type: NodePort
  selector:
    app: node-exporter
检验node-exporter是否成功运行
$ kubectl get pod -n ns-monitor

NAME                         READY   STATUS    RESTARTS   AGE
grafana-576db894c6-tvvgx     1/1     Running   0          2d15h
node-exporter-jkt2g          1/1     Running   2          2d17h
node-exporter-lkk27          1/1     Running   2          2d17h
prometheus-dd69c4889-d8hf6   1/1     Running   0          2d15h
浏览器访问: http://主机ip:31672/metrics
-
部署Prometheus pod
prometheus.yaml 中包含rbac认证、ConfigMap等。
#编写prometheus.yaml文件 --- apiVersion: rbac.authorization.k8s.io/v1beta1 kind: ClusterRole metadata: name: prometheus rules: - apiGroups: [""] # "" indicates the core API group resources: - nodes - nodes/proxy - services - endpoints - pods verbs: - get - watch - list - apiGroups: - extensions resources: - ingresses verbs: - get - watch - list - nonResourceURLs: ["/metrics"] verbs: - get --- apiVersion: v1 kind: ServiceAccount metadata: name: prometheus namespace: ns-monitor labels: app: prometheus --- apiVersion: rbac.authorization.k8s.io/v1beta1 kind: ClusterRoleBinding metadata: name: prometheus subjects: - kind: ServiceAccount name: prometheus namespace: ns-monitor roleRef: kind: ClusterRole name: prometheus apiGroup: rbac.authorization.k8s.io --- apiVersion: v1 kind: ConfigMap metadata: name: prometheus-conf namespace: ns-monitor labels: app: prometheus data: prometheus.yml: |- # my global config global: scrape_interval: 15s # Set the scrape interval to every 15 seconds. Default is every 1 minute. evaluation_interval: 15s # Evaluate rules every 15 seconds. The default is every 1 minute. # scrape_timeout is set to the global default (10s). # Alertmanager configuration alerting: alertmanagers: - static_configs: - targets: # - alertmanager:9093 # Load rules once and periodically evaluate them according to the global 'evaluation_interval'. rule_files: # - "first_rules.yml" # - "second_rules.yml" # A scrape configuration containing exactly one endpoint to scrape: # Here it's Prometheus itself. scrape_configs: # The job name is added as a label `job=` to any timeseries scraped from this config. - job_name: 'prometheus' # metrics_path defaults to '/metrics' # scheme defaults to 'http'. static_configs: - targets: ['localhost:9090'] - job_name: 'grafana' static_configs: - targets: - 'grafana-service.ns-monitor:3000' - job_name: 'kubernetes-apiservers' kubernetes_sd_configs: - role: endpoints # Default to scraping over https. If required, just disable this or change to # `http`. scheme: https # This TLS & bearer token file config is used to connect to the actual scrape # endpoints for cluster components. This is separate to discovery auth # configuration because discovery & scraping are two separate concerns in # Prometheus. The discovery auth config is automatic if Prometheus runs inside # the cluster. Otherwise, more config options have to be provided within the #. tls_config: ca_file: /var/run/secrets/kubernetes.io/serviceaccount/ca.crt # If your node certificates are self-signed or use a different CA to the # master CA, then disable certificate verification below. Note that # certificate verification is an integral part of a secure infrastructure # so this should only be disabled in a controlled environment. You can # disable certificate verification by uncommenting the line below. # # insecure_skip_verify: true bearer_token_file: /var/run/secrets/kubernetes.io/serviceaccount/token # Keep only the default/kubernetes service endpoints for the https port. This # will add targets for each API server which Kubernetes adds an endpoint to # the default/kubernetes service. relabel_configs: - source_labels: [__meta_kubernetes_namespace, __meta_kubernetes_service_name, __meta_kubernetes_endpoint_port_name] action: keep regex: default;kubernetes;https # Scrape config for nodes (kubelet). # # Rather than connecting directly to the node, the scrape is proxied though the # Kubernetes apiserver. This means it will work if Prometheus is running out of # cluster, or can't connect to nodes for some other reason (e.g. because of # firewalling). - job_name: 'kubernetes-nodes' # Default to scraping over https. If required, just disable this or change to # `http`. scheme: https # This TLS & bearer token file config is used to connect to the actual scrape # endpoints for cluster components. This is separate to discovery auth # configuration because discovery & scraping are two separate concerns in # Prometheus. The discovery auth config is automatic if Prometheus runs inside # the cluster. Otherwise, more config options have to be provided within the #. tls_config: ca_file: /var/run/secrets/kubernetes.io/serviceaccount/ca.crt bearer_token_file: /var/run/secrets/kubernetes.io/serviceaccount/token kubernetes_sd_configs: - role: node relabel_configs: - action: labelmap regex: __meta_kubernetes_node_label_(.+) - target_label: __address__ replacement: kubernetes.default.svc:443 - source_labels: [__meta_kubernetes_node_name] regex: (.+) target_label: __metrics_path__ replacement: /api/v1/nodes/${1}/proxy/metrics # Scrape config for Kubelet cAdvisor. # # This is required for Kubernetes 1.7.3 and later, where cAdvisor metrics # (those whose names begin with 'container_') have been removed from the # Kubelet metrics endpoint. This job scrapes the cAdvisor endpoint to # retrieve those metrics. # # In Kubernetes 1.7.0-1.7.2, these metrics are only exposed on the cAdvisor # HTTP endpoint; use "replacement: /api/v1/nodes/${1}:4194/proxy/metrics" # in that case (and ensure cAdvisor's HTTP server hasn't been disabled with # the --cadvisor-port=0 Kubelet flag). # # This job is not necessary and should be removed in Kubernetes 1.6 and # earlier versions, or it will cause the metrics to be scraped twice. - job_name: 'kubernetes-cadvisor' # Default to scraping over https. If required, just disable this or change to # `http`. scheme: https # This TLS & bearer token file config is used to connect to the actual scrape # endpoints for cluster components. This is separate to discovery auth # configuration because discovery & scraping are two separate concerns in # Prometheus. The discovery auth config is automatic if Prometheus runs inside # the cluster. Otherwise, more config options have to be provided within the #. tls_config: ca_file: /var/run/secrets/kubernetes.io/serviceaccount/ca.crt bearer_token_file: /var/run/secrets/kubernetes.io/serviceaccount/token kubernetes_sd_configs: - role: node relabel_configs: - action: labelmap regex: __meta_kubernetes_node_label_(.+) - target_label: __address__ replacement: kubernetes.default.svc:443 - source_labels: [__meta_kubernetes_node_name] regex: (.+) target_label: __metrics_path__ replacement: /api/v1/nodes/${1}/proxy/metrics/cadvisor # Scrape config for service endpoints. # # The relabeling allows the actual service scrape endpoint to be configured # via the following annotations: # # * `prometheus.io/scrape`: Only scrape services that have a value of `true` # * `prometheus.io/scheme`: If the metrics endpoint is secured then you will need # to set this to `https` & most likely set the `tls_config` of the scrape config. # * `prometheus.io/path`: If the metrics path is not `/metrics` override this. # * `prometheus.io/port`: If the metrics are exposed on a different port to the # service then set this appropriately. - job_name: 'kubernetes-service-endpoints' kubernetes_sd_configs: - role: endpoints relabel_configs: - source_labels: [__meta_kubernetes_service_annotation_prometheus_io_scrape] action: keep regex: true - source_labels: [__meta_kubernetes_service_annotation_prometheus_io_scheme] action: replace target_label: __scheme__ regex: (https?) - source_labels: [__meta_kubernetes_service_annotation_prometheus_io_path] action: replace target_label: __metrics_path__ regex: (.+) - source_labels: [__address__, __meta_kubernetes_service_annotation_prometheus_io_port] action: replace target_label: __address__ regex: ([^:]+)(?::\d+)?;(\d+) replacement: $1:$2 - action: labelmap regex: __meta_kubernetes_service_label_(.+) - source_labels: [__meta_kubernetes_namespace] action: replace target_label: kubernetes_namespace - source_labels: [__meta_kubernetes_service_name] action: replace target_label: kubernetes_name # Example scrape config for probing services via the Blackbox Exporter. # # The relabeling allows the actual service scrape endpoint to be configured # via the following annotations: # # * `prometheus.io/probe`: Only probe services that have a value of `true` - job_name: 'kubernetes-services' metrics_path: /probe params: module: [http_2xx] kubernetes_sd_configs: - role: service relabel_configs: - source_labels: [__meta_kubernetes_service_annotation_prometheus_io_probe] action: keep regex: true - source_labels: [__address__] target_label: __param_target - target_label: __address__ replacement: blackbox-exporter.example.com:9115 - source_labels: [__param_target] target_label: instance - action: labelmap regex: __meta_kubernetes_service_label_(.+) - source_labels: [__meta_kubernetes_namespace] target_label: kubernetes_namespace - source_labels: [__meta_kubernetes_service_name] target_label: kubernetes_name # Example scrape config for probing ingresses via the Blackbox Exporter. # # The relabeling allows the actual ingress scrape endpoint to be configured # via the following annotations: # # * `prometheus.io/probe`: Only probe services that have a value of `true` - job_name: 'kubernetes-ingresses' metrics_path: /probe params: module: [http_2xx] kubernetes_sd_configs: - role: ingress relabel_configs: - source_labels: [__meta_kubernetes_ingress_annotation_prometheus_io_probe] action: keep regex: true - source_labels: [__meta_kubernetes_ingress_scheme,__address__,__meta_kubernetes_ingress_path] regex: (.+);(.+);(.+) replacement: ${1}://${2}${3} target_label: __param_target - target_label: __address__ replacement: blackbox-exporter.example.com:9115 - source_labels: [__param_target] target_label: instance - action: labelmap regex: __meta_kubernetes_ingress_label_(.+) - source_labels: [__meta_kubernetes_namespace] target_label: kubernetes_namespace - source_labels: [__meta_kubernetes_ingress_name] target_label: kubernetes_name # Example scrape config for pods # # The relabeling allows the actual pod scrape endpoint to be configured via the # following annotations: # # * `prometheus.io/scrape`: Only scrape pods that have a value of `true` # * `prometheus.io/path`: If the metrics path is not `/metrics` override this. # * `prometheus.io/port`: Scrape the pod on the indicated port instead of the # pod's declared ports (default is a port-free target if none are declared). - job_name: 'kubernetes-pods' kubernetes_sd_configs: - role: pod relabel_configs: - source_labels: [__meta_kubernetes_pod_annotation_prometheus_io_scrape] action: keep regex: true - source_labels: [__meta_kubernetes_pod_annotation_prometheus_io_path] action: replace target_label: __metrics_path__ regex: (.+) - source_labels: [__address__, __meta_kubernetes_pod_annotation_prometheus_io_port] action: replace regex: ([^:]+)(?::\d+)?;(\d+) replacement: $1:$2 target_label: __address__ - action: labelmap regex: __meta_kubernetes_pod_label_(.+) - source_labels: [__meta_kubernetes_namespace] action: replace target_label: kubernetes_namespace - source_labels: [__meta_kubernetes_pod_name] action: replace target_label: kubernetes_pod_name --- apiVersion: v1 kind: ConfigMap metadata: name: prometheus-rules namespace: ns-monitor labels: app: prometheus data: cpu-usage.rule: | groups: - name: NodeCPUUsage rules: - alert: NodeCPUUsage expr: (100 - (avg by (instance) (irate(node_cpu{name="node-exporter",mode="idle"}[5m])) * 100)) > 75 for: 2m labels: severity: "page" annotations: summary: "{{$labels.instance}}: High CPU usage detected" description: "{{$labels.instance}}: CPU usage is above 75% (current value is: {{ $value }})" --- apiVersion: v1 kind: PersistentVolume metadata: name: "prometheus-data-pv" labels: name: prometheus-data-pv release: stable spec: capacity: storage: 5Gi accessModes: - ReadWriteOnce persistentVolumeReclaimPolicy: Recycle nfs: path: /nfs/prometheus/data server: 192.168.0.111 --- apiVersion: v1 kind: PersistentVolumeClaim metadata: name: prometheus-data-pvc namespace: ns-monitor spec: accessModes: - ReadWriteOnce resources: requests: storage: 5Gi selector: matchLabels: name: prometheus-data-pv release: stable --- kind: Deployment apiVersion: apps/v1 metadata: labels: app: prometheus name: prometheus namespace: ns-monitor spec: replicas: 1 revisionHistoryLimit: 10 selector: matchLabels: app: prometheus template: metadata: labels: app: prometheus spec: serviceAccountName: prometheus securityContext: runAsUser: 0 containers: - name: prometheus image: prom/prometheus:latest imagePullPolicy: IfNotPresent volumeMounts: - mountPath: /prometheus name: prometheus-data-volume - mountPath: /etc/prometheus/prometheus.yml name: prometheus-conf-volume subPath: prometheus.yml - mountPath: /etc/prometheus/rules name: prometheus-rules-volume ports: - containerPort: 9090 protocol: TCP volumes: - name: prometheus-data-volume persistentVolumeClaim: claimName: prometheus-data-pvc - name: prometheus-conf-volume configMap: name: prometheus-conf - name: prometheus-rules-volume configMap: name: prometheus-rules tolerations: - key: node-role.kubernetes.io/master effect: NoSchedule --- kind: Service apiVersion: v1 metadata: annotations: prometheus.io/scrape: 'true' labels: app: prometheus name: prometheus-service namespace: ns-monitor spec: ports: - port: 9090 targetPort: 9090 selector: app: prometheus type: NodePortkubectl apply -f prometheus.yaml检验是否正常运行
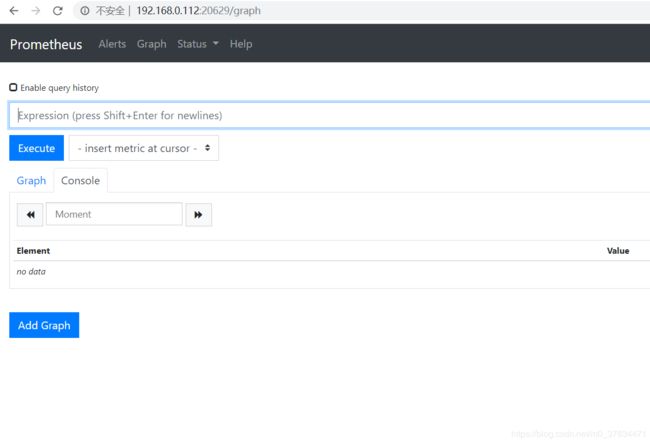
$ kubectl get pod -n ns-monitor

NAME                         READY   STATUS    RESTARTS   AGE
grafana-576db894c6-tvvgx     1/1     Running   0          2d15h
node-exporter-jkt2g          1/1     Running   2          2d17h
node-exporter-lkk27          1/1     Running   2          2d17h
prometheus-dd69c4889-d8hf6   1/1     Running   0          2d15h
kubectl get svc -n ns-monitor NAME TYPE CLUSTER-IP EXTERNAL-IP PORT(S) AGE grafana-service NodePort 192.168.0.130 <none> 3000:31683/TCP 2d15h node-exporter-service NodePort 192.168.0.210 <none> 9100:31672/TCP 2d17h prometheus-service NodePort 192.168.0.226 <none> 9090:20629/TCP 2d15h浏览器访问: http://主机ip:20629/graph
安装Grafana
-
安装grafana
#编写grafana.yml文件
apiVersion: v1
kind: PersistentVolume
metadata:
  name: "grafana-data-pv"
  labels:
    name: grafana-data-pv
    release: stable
spec:
  capacity:
    storage: 5Gi
  accessModes:
    - ReadWriteOnce
  persistentVolumeReclaimPolicy: Recycle
  nfs:
    path: /nfs/grafana/data
    server: 192.168.0.111
---
apiVersion: v1
kind: PersistentVolumeClaim
metadata:
  name: grafana-data-pvc
  namespace: ns-monitor
spec:
  accessModes:
    - ReadWriteOnce
  resources:
    requests:
      storage: 5Gi
  selector:
    matchLabels:
      name: grafana-data-pv
      release: stable
---
kind: Deployment
apiVersion: apps/v1
metadata:
  labels:
    app: grafana
  name: grafana
  namespace: ns-monitor
spec:
  replicas: 1
  revisionHistoryLimit: 10
  selector:
    matchLabels:
      app: grafana
  template:
    metadata:
      labels:
        app: grafana
    spec:
      securityContext:
        runAsUser: 0
      containers:
        - name: grafana
          image: grafana/grafana:latest
          imagePullPolicy: IfNotPresent
          env:
            - name: GF_AUTH_BASIC_ENABLED
              value: "true"
            - name: GF_AUTH_ANONYMOUS_ENABLED
              value: "false"
          readinessProbe:
            httpGet:
              path: /login
              port: 3000
          volumeMounts:
            - mountPath: /var/lib/grafana
              name: grafana-data-volume
          ports:
            - containerPort: 3000
              protocol: TCP
      volumes:
        - name: grafana-data-volume
          persistentVolumeClaim:
            claimName: grafana-data-pvc
---
kind: Service
apiVersion: v1
metadata:
  labels:
    app: grafana
  name: grafana-service
  namespace: ns-monitor
spec:
  ports:
    - port: 3000
      targetPort: 3000
  selector:
    app: grafana
  type: NodePort
kubectl apply -f grafana.yaml检验是否正常运行
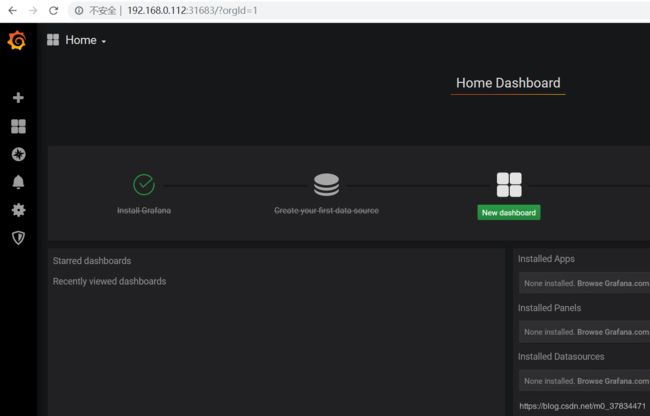
$ kubectl get pod -n ns-monitor

NAME                          READY   STATUS
grafana-677d945674-56m5n      1/1     Running
node-exporter-vkpt2           1/1     Running
node-exporter-zkh9s           1/1     Running
prometheus-6c9574d5ff-292bq   1/1     Running

$ kubectl get svc -n ns-monitor
NAME                    TYPE       CLUSTER-IP      EXTERNAL-IP   PORT(S)          AGE
grafana-service         NodePort   192.168.0.130   <none>        3000:31683/TCP   2d16h
node-exporter-service   NodePort   192.168.0.210   <none>        9100:31672/TCP   2d18h
prometheus-service      NodePort   192.168.0.226   <none>        9090:20629/TCP   2d16h
浏览器访问: http://主机ip:31683/graph/login 默认用户名和密码:admin/admin
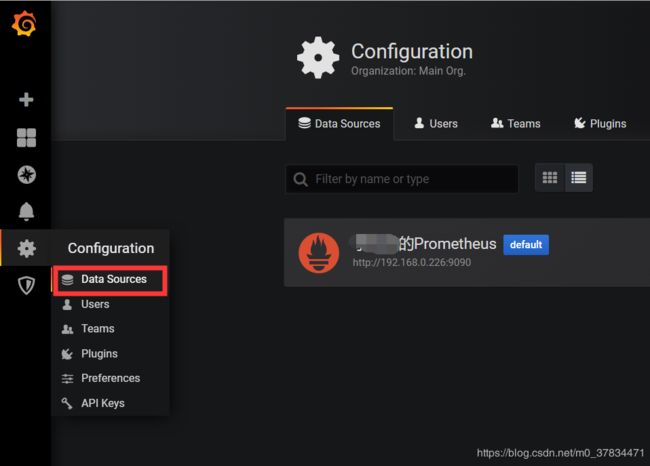
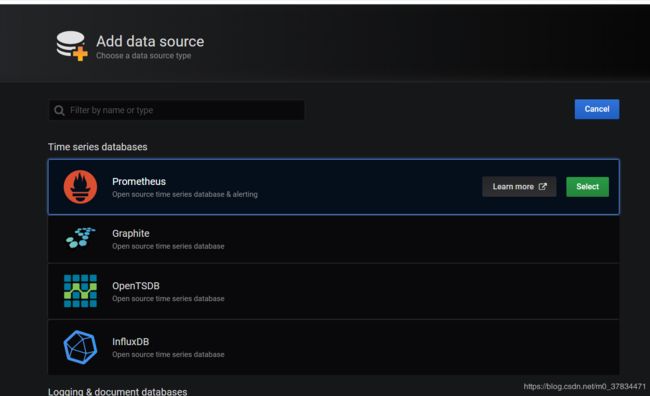
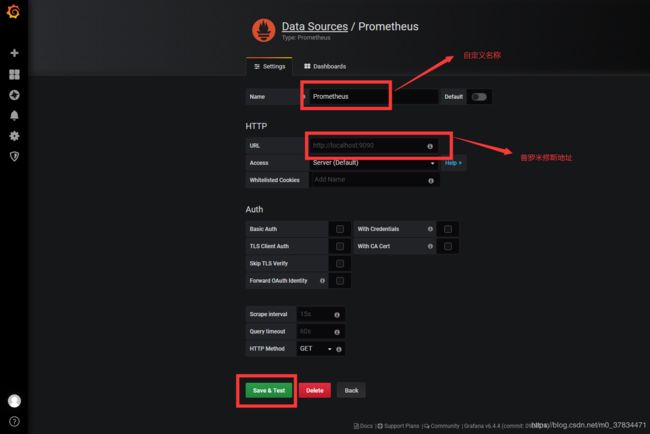
-
配置grafana数据源