Kubernetes15--Custom-Metrics自定义监控指标
Metric可以实现对于pod以及node对象cpu,内存指标的监控,要想获取更多的监控指标,可以使用custom-metrics自定义监控指标。
部署prometheus监控系统,prometheus采集其它各种指标,使用组件kube-state-metrics,将prometheus的metrics数据格式转换成k8s API接口能识别的格式,转换以后,用Kubernetes aggregator在主API服务器中注册,以便直接通过/apis/来访问。
Custom Metrics 部署流程
1. node-exporter:prometheus的agent端,收集Node级别的监控数据。
2. prometheus:监控服务端,从node-exporter拉数据并存储为时序数据。
3. kube-state-metrics: 将prometheus中可以用PromQL查询到的指标数据转换成k8s对应的数据格式,即转换成【Custerom Metrics API】接口格式的数据,但是它不能聚合进apiserver中的功能。
4. k8s-prometheus-adpater:聚合apiserver,即提供了一个apiserver【cuester-metrics-api】,自定义APIServer通常都要通过Kubernetes aggregator聚合到apiserver。
1.创建monitor命名空间:
[root@Ac-private-1 custom-metrics]# cat monitor-namespace.yaml
---
apiVersion: v1
kind: Namespace
metadata:
  name: monitoring
kubectl apply -f monitor-namespace.yaml

2.部署node-exporter服务:
node-exporter:prometheus的agent端,收集Node级别的监控数据
https://github.com/mgxian/k8s-monitor/blob/master/node_exporter.yaml
---
apiVersion: extensions/v1beta1
kind: DaemonSet
metadata:
  name: node-exporter
  namespace: monitoring
  labels:
    k8s-app: node-exporter
spec:
  template:
    metadata:
      labels:
        k8s-app: node-exporter
    spec:
      containers:
      - image: prom/node-exporter
        name: node-exporter
        ports:
        - containerPort: 9100
          protocol: TCP
          name: http
---
apiVersion: v1
kind: Service
metadata:
  labels:
    k8s-app: node-exporter
  name: node-exporter
  namespace: monitoring
spec:
  ports:
  - name: http
    port: 9100
    nodePort: 31672
    protocol: TCP
  type: NodePort
  selector:
    k8s-app: node-exporter
端口映射31672---9100,宿主机暴露了31672端口:
curl http://192.168.1.16:31672/metrics
可以访问到宿主机的性能指标数据:cpu,mem,fs,net等指标数据
3.部署prometheus
prometheus:监控服务端,从node-exporter拉数据并存储为时序数据
https://github.com/stefanprodan/k8s-prom-hpa/tree/master/prometheus

rbac.yaml配置文件:
[root@Ac-private-1 prometheus]# cat prometheus-rbac.yaml
---
apiVersion: rbac.authorization.k8s.io/v1beta1
kind: ClusterRole
metadata:
  name: prometheus
rules:
- apiGroups: [""]
  resources:
  - nodes
  - nodes/proxy
  - services
  - endpoints
  - pods
  verbs: ["get", "list", "watch"]
- apiGroups:
  - extensions
  resources:
  - ingresses
  verbs: ["get", "list", "watch"]
- nonResourceURLs: ["/metrics"]
  verbs: ["get"]
---
apiVersion: v1
kind: ServiceAccount
metadata:
  name: prometheus
  namespace: monitoring
---
apiVersion: rbac.authorization.k8s.io/v1beta1
kind: ClusterRoleBinding
metadata:
  name: prometheus
roleRef:
  apiGroup: rbac.authorization.k8s.io
  kind: ClusterRole
  name: prometheus
subjects:
- kind: ServiceAccount
  name: prometheus
  namespace: monitoring
svc.yaml配置文件
[root@Ac-private-1 prometheus]# cat prometheus-svc.yaml
---
apiVersion: v1
kind: Service
metadata:
  name: prometheus
  namespace: monitoring
  labels:
    app: prometheus
spec:
  type: NodePort
  ports:
    - port: 9090
      targetPort: 9090
      nodePort: 31190
      protocol: TCP
  selector:
    app: prometheus
dep.yaml配置文件:
[root@Ac-private-1 prometheus]# cat prometheus-dep.yaml
---
apiVersion: apps/v1beta2
kind: Deployment
metadata:
  name: prometheus
  namespace: monitoring
spec:
  replicas: 1
  selector:
    matchLabels:
      app: prometheus
  template:
    metadata:
      labels:
        app: prometheus
      annotations:
        prometheus.io/scrape: 'false'
    spec:
      serviceAccountName: prometheus
      containers:
      - name: prometheus
        image: prom/prometheus:v2.1.0
        imagePullPolicy: Always
        command:
          - prometheus
          - --config.file=/etc/prometheus/prometheus.yml
          - --storage.tsdb.retention=1h
        ports:
        - containerPort: 9090
          protocol: TCP
        resources:
          limits:
            memory: 2Gi
        volumeMounts:
        - mountPath: /etc/prometheus/prometheus.yml
          name: prometheus-config
          subPath: prometheus.yml
      volumes:
        - name: prometheus-config
          configMap:
            name: prometheus-config
            items:
              - key: prometheus.yml
                path: prometheus.yml
                mode: 0644
cfg.yaml配置文件:
[root@Ac-private-1 prometheus]# cat prometheus-cfg.yaml
---
kind: ConfigMap
apiVersion: v1
metadata:
  labels:
    app: prometheus
  name: prometheus-config
  namespace: monitoring
data:
  prometheus.yml: |
    # A scrape configuration for running Prometheus on a Kubernetes cluster.
    # This uses separate scrape configs for cluster components (i.e. API server, node)
    # and services to allow each to use different authentication configs.
    #
    # Kubernetes labels will be added as Prometheus labels on metrics via the
    # `labelmap` relabeling action.
    #
    # If you are using Kubernetes 1.7.2 or earlier, please take note of the comments
    # for the kubernetes-cadvisor job; you will need to edit or remove this job.
    # Scrape config for API servers.
    #
    # Kubernetes exposes API servers as endpoints to the default/kubernetes
    # service so this uses `endpoints` role and uses relabelling to only keep
    # the endpoints associated with the default/kubernetes service using the
    # default named port `https`. This works for single API server deployments as
    # well as HA API server deployments.
    global:
      scrape_interval: 15s
      scrape_timeout: 10s
      evaluation_interval: 1m
    scrape_configs:
    - job_name: 'kubernetes-apiservers'
      kubernetes_sd_configs:
      - role: endpoints
      # Default to scraping over https. If required, just disable this or change to
      # `http`.
      scheme: https
      # This TLS & bearer token file config is used to connect to the actual scrape
      # endpoints for cluster components. This is separate to discovery auth
      # configuration because discovery & scraping are two separate concerns in
      # Prometheus. The discovery auth config is automatic if Prometheus runs inside
      # the cluster. Otherwise, more config options have to be provided within the
      # .
      tls_config:
        ca_file: /var/run/secrets/kubernetes.io/serviceaccount/ca.crt
        # If your node certificates are self-signed or use a different CA to the
        # master CA, then disable certificate verification below. Note that
        # certificate verification is an integral part of a secure infrastructure
        # so this should only be disabled in a controlled environment. You can
        # disable certificate verification by uncommenting the line below.
        #
        # insecure_skip_verify: true
      bearer_token_file: /var/run/secrets/kubernetes.io/serviceaccount/token
      # Keep only the default/kubernetes service endpoints for the https port. This
      # will add targets for each API server which Kubernetes adds an endpoint to
      # the default/kubernetes service.
      relabel_configs:
      - source_labels: [__meta_kubernetes_namespace, __meta_kubernetes_service_name, __meta_kubernetes_endpoint_port_name]
        action: keep
        regex: default;kubernetes;https
    - job_name: 'kubernetes-nodes'
      # Default to scraping over https. If required, just disable this or change to
      # `http`.
      scheme: https
      # This TLS & bearer token file config is used to connect to the actual scrape
      # endpoints for cluster components. This is separate to discovery auth
      # configuration because discovery & scraping are two separate concerns in
      # Prometheus. The discovery auth config is automatic if Prometheus runs inside
      # the cluster. Otherwise, more config options have to be provided within the
      # .
      tls_config:
        ca_file: /var/run/secrets/kubernetes.io/serviceaccount/ca.crt
      bearer_token_file: /var/run/secrets/kubernetes.io/serviceaccount/token
      kubernetes_sd_configs:
      - role: node
      relabel_configs:
      - action: labelmap
        regex: __meta_kubernetes_node_label_(.+)
      - target_label: __address__
        replacement: 192.168.1.15:6443
      - source_labels: [__meta_kubernetes_node_name]
        regex: (.+)
        target_label: __metrics_path__
        replacement: /api/v1/nodes/${1}/proxy/metrics
    # Scrape config for Kubelet cAdvisor.
    #
    # This is required for Kubernetes 1.7.3 and later, where cAdvisor metrics
    # (those whose names begin with 'container_') have been removed from the
    # Kubelet metrics endpoint.  This job scrapes the cAdvisor endpoint to
    # retrieve those metrics.
    #
    # In Kubernetes 1.7.0-1.7.2, these metrics are only exposed on the cAdvisor
    # HTTP endpoint; use "replacement: /api/v1/nodes/${1}:4194/proxy/metrics"
    # in that case (and ensure cAdvisor's HTTP server hasn't been disabled with
    # the --cadvisor-port=0 Kubelet flag).
    #
    # This job is not necessary and should be removed in Kubernetes 1.6 and
    # earlier versions, or it will cause the metrics to be scraped twice.
    - job_name: 'kubernetes-cadvisor'
      # Default to scraping over https. If required, just disable this or change to
      # `http`.
      scheme: https
      # This TLS & bearer token file config is used to connect to the actual scrape
      # endpoints for cluster components. This is separate to discovery auth
      # configuration because discovery & scraping are two separate concerns in
      # Prometheus. The discovery auth config is automatic if Prometheus runs inside
      # the cluster. Otherwise, more config options have to be provided within the
      # .
      tls_config:
        ca_file: /var/run/secrets/kubernetes.io/serviceaccount/ca.crt
      bearer_token_file: /var/run/secrets/kubernetes.io/serviceaccount/token
      kubernetes_sd_configs:
      - role: node
      relabel_configs:
      - action: labelmap
        regex: __meta_kubernetes_node_label_(.+)
      - target_label: __address__
        replacement: 192.168.1.15:6443
      - source_labels: [__meta_kubernetes_node_name]
        regex: (.+)
        target_label: __metrics_path__
        replacement: /api/v1/nodes/${1}/proxy/metrics/cadvisor
    # Scrape config for service endpoints.
    #
    # The relabeling allows the actual service scrape endpoint to be configured
    # via the following annotations:
    #
    # * `prometheus.io/scrape`: Only scrape services that have a value of `true`
    # * `prometheus.io/scheme`: If the metrics endpoint is secured then you will need
    # to set this to `https` & most likely set the `tls_config` of the scrape config.
    # * `prometheus.io/path`: If the metrics path is not `/metrics` override this.
    # * `prometheus.io/port`: If the metrics are exposed on a different port to the
    # service then set this appropriately.
    - job_name: 'kubernetes-service-endpoints'
      kubernetes_sd_configs:
      - role: endpoints
      relabel_configs:
      - source_labels: [__meta_kubernetes_service_annotation_prometheus_io_scrape]
        action: keep
        regex: true
      - source_labels: [__meta_kubernetes_service_annotation_prometheus_io_scheme]
        action: replace
        target_label: __scheme__
        regex: (https?)
      - source_labels: [__meta_kubernetes_service_annotation_prometheus_io_path]
        action: replace
        target_label: __metrics_path__
        regex: (.+)
      - source_labels: [__address__, __meta_kubernetes_service_annotation_prometheus_io_port]
        action: replace
        target_label: __address__
        regex: ([^:]+)(?::\d+)?;(\d+)
        replacement: $1:$2
      - action: labelmap
        regex: __meta_kubernetes_service_label_(.+)
      - source_labels: [__meta_kubernetes_namespace]
        action: replace
        target_label: kubernetes_namespace
      - source_labels: [__meta_kubernetes_service_name]
        action: replace
        target_label: kubernetes_name
    # Example scrape config for pods
    #
    # The relabeling allows the actual pod scrape endpoint to be configured via the
    # following annotations:
    #
    # * `prometheus.io/scrape`: Only scrape pods that have a value of `true`
    # * `prometheus.io/path`: If the metrics path is not `/metrics` override this.
    # * `prometheus.io/port`: Scrape the pod on the indicated port instead of the
    # pod's declared ports (default is a port-free target if none are declared).
    - job_name: 'kubernetes-pods'
      # if you want to use metrics on jobs, set the below field to
      # true to prevent Prometheus from setting the `job` label
      # automatically.
      honor_labels: false
      kubernetes_sd_configs:
      - role: pod
      # skip verification so you can do HTTPS to pods
      tls_config:
        insecure_skip_verify: true
      # make sure your labels are in order
      relabel_configs:
      # these labels tell Prometheus to automatically attach source
      # pod and namespace information to each collected sample, so
      # that they'll be exposed in the custom metrics API automatically.
      - source_labels: [__meta_kubernetes_namespace]
        action: replace
        target_label: namespace
      - source_labels: [__meta_kubernetes_pod_name]
        action: replace
        target_label: pod
      # these labels tell Prometheus to look for
      # prometheus.io/{scrape,path,port} annotations to configure
      # how to scrape
      - source_labels: [__meta_kubernetes_pod_annotation_prometheus_io_scrape]
        action: keep
        regex: true
      - source_labels: [__meta_kubernetes_pod_annotation_prometheus_io_path]
        action: replace
        target_label: __metrics_path__
        regex: (.+)
      - source_labels: [__address__, __meta_kubernetes_pod_annotation_prometheus_io_port]
        action: replace
        regex: ([^:]+)(?::\d+)?;(\d+)
        replacement: $1:$2
        target_label: __address__
      - source_labels: [__meta_kubernetes_pod_annotation_prometheus_io_scheme]
        action: replace
        target_label: __scheme__
        regex: (.+)
    - job_name: 'kubernetes-nodes-physical'
      kubernetes_sd_configs:
      - role: node
      relabel_configs:
      - action: labelmap
        regex: __meta_kubernetes_node_label_(.+)
      - source_labels: [__meta_kubernetes_role]
        action: replace
        target_label: kubernetes_role
      - source_labels: [__address__]
        regex: '(.*):10250'
        replacement: '${1}:31672'
        target_label: __address__
cfg中定义了prometheus中数据来源,其中Node物理节点数据由node-exporter来收集,容器数据使用Cadvisor来收集,注意端口号以及IP的对应性,保证可以正确访问到数据源

服务对外暴露31190端口,可以图形化访问服务以及各种性能指标
以下是prometheus接入数据源的信息

访问容器的IO状态

访问Node的IO状态

4.部署kube-state-metrics
将prometheus中可以用PromQL查询到的指标数据转换成k8s对应的数据格式,即转换成【Custerom Metrics API】接口格式的数据
https://github.com/mgxian/k8s-monitor/blob/master/kube-state-metrics.yaml

5.部署组件k8s-prometheus-adapter
https://github.com/stefanprodan/k8s-prom-hpa/tree/master/custom-metrics-api

6.Grafana图形化显示Promethues数据
部署Grafana
kubectl apply -f grafana.yaml
apiVersion: extensions/v1beta1
kind: Deployment
metadata:
  name: monitoring-grafana
  namespace: kube-system
spec:
  replicas: 1
  template:
    metadata:
      labels:
        task: monitoring
        k8s-app: grafana
    spec:
      containers:
      - name: grafana
        image: daocloud.io/liukuan73/grafana:5.0.0
        imagePullPolicy: IfNotPresent
        ports:
        - containerPort: 3000
          protocol: TCP
        volumeMounts:
        - mountPath: /var
          name: grafana-storage
        env:
        - name: INFLUXDB_HOST
          value: monitoring-influxdb
        - name: GF_SERVER_HTTP_PORT
          value: "3000"
          # The following env variables are required to make Grafana accessible via
          # the kubernetes api-server proxy. On production clusters, we recommend
          # removing these env variables, setup auth for grafana, and expose the grafana
          # service using a LoadBalancer or a public IP.
        - name: GF_AUTH_BASIC_ENABLED
          value: "false"
        - name: GF_AUTH_ANONYMOUS_ENABLED
          value: "true"
        - name: GF_AUTH_ANONYMOUS_ORG_ROLE
          value: Admin
        - name: GF_SERVER_ROOT_URL
          # If you're only using the API Server proxy, set this value instead:
          # value: /api/v1/namespaces/kube-system/services/monitoring-grafana/proxy
          value: /
      volumes:
      - name: grafana-storage
        emptyDir: {}
      #nodeSelector:
        #node-role.kubernetes.io/master: "true"
      #tolerations:
      #- key: "node-role.kubernetes.io/master"
        #effect: "NoSchedule"
---
apiVersion: v1
kind: Service
metadata:
  labels:
    # For use as a Cluster add-on (https://github.com/kubernetes/kubernetes/tree/master/cluster/addons)
    # If you are NOT using this as an addon, you should comment out this line.
    kubernetes.io/cluster-service: 'true'
    kubernetes.io/name: monitoring-grafana
  annotations:
    prometheus.io/scrape: 'true'
    prometheus.io/tcp-probe: 'true'
    prometheus.io/tcp-probe-port: '80'
  name: monitoring-grafana
  namespace: kube-system
spec:
  type: NodePort
  # In a production setup, we recommend accessing Grafana through an external Loadbalancer
  # or through a public IP.
  # type: LoadBalancer
  # You could also use NodePort to expose the service at a randomly-generated port
  # type: NodePort
  ports:
  - port: 80
    targetPort: 3000
    nodePort: 30007
  selector:
    k8s-app: grafana
访问Grafanaweb页面 http://nodeIp:30007

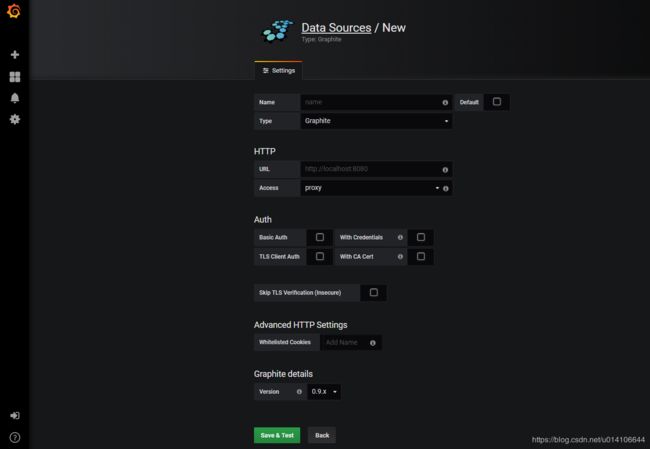
添加数据源:
添加显示模板,模板文件可以参考官网https://grafana.com/dashboards
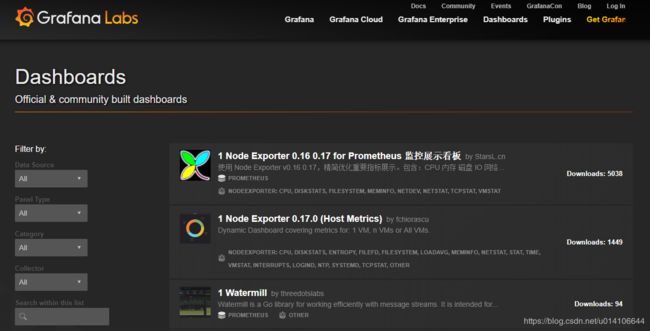
下载模板json文件,上传至grafana服务端

查看效果:

参考链接:
https://github.com/kubernetes-incubator/custom-metrics-apiserver/blob/master/docs/getting-started.md
https://github.com/stefanprodan/k8s-prom-hpa/tree/master/prometheus
https://cloud.tencent.com/info/d735182c2b8aa8380b5752dc5d2c972c.html
https://github.com/prometheus/node_exporter
https://www.kubernetes.org.cn/4438.html
https://blog.csdn.net/sinat_35930259/article/details/80456470
https://github.com/liukuan73/kubernetes-addons/blob/master/monitor/prometheus%2Bgrafana/node-exporter-daemonset.yaml
https://github.com/kubernetes/kubernetes/tree/master/cluster/addons/prometheus
http://blog.51cto.com/newfly/2299768
https://blog.csdn.net/liukuan73/article/details/78881008
https://github.com/liukuan73/kubernetes-addons/blob/master/monitor