C++ 曲线平滑
最近需要将数据通过图表展示出来,以便观察其变化趋势。直接展示出来的效果不是很好,故在网上查找了很久曲线平滑的方法,最终找到了了一套比较适合的方法,思路比较简单,对于现在的项目来说效果也还不错,故记录一下。
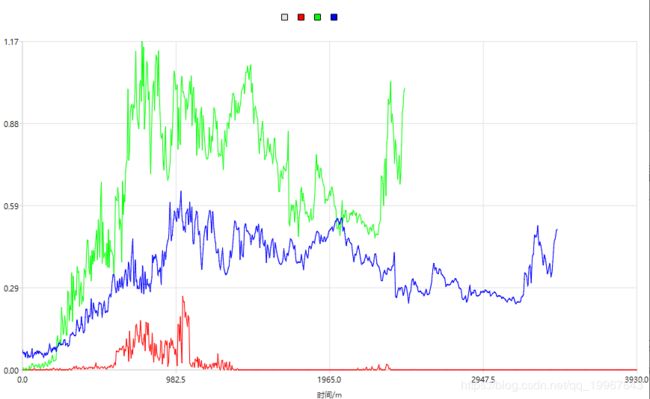
原始数据大小分别为881、490和1711,直接展示如下图所示:
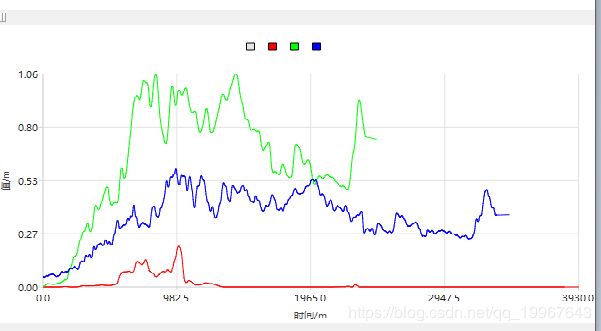
由于采集过程中传感器数据变化比较敏感,所以有比较明显的锯齿,故第一步需要去差值。这里采用的是“五点去差值法”,即选周围五个点,去掉最大值和最小值求剩余三个点的平均,使其相邻点变得平滑。这里作了SIZE/20次去差值,去差值后如下图所示:
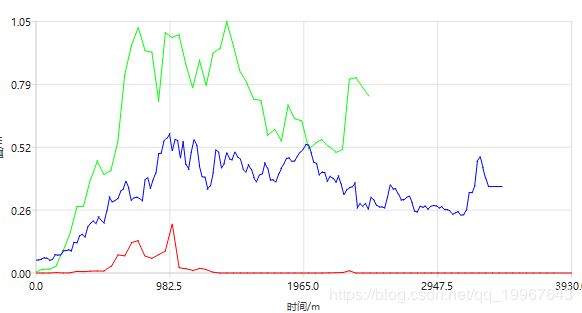
经过多次反复去差值后,可以看到曲线明显变得平滑了许多,也没有明显的锯齿了。但是我们只关心曲线的大致趋势,不需要那么多细节。由于前面已经将曲线相邻点变得比较平滑了,故下一步就直接减少点的数量,这里将数据量减少了十倍,减少数据量后效果如下:
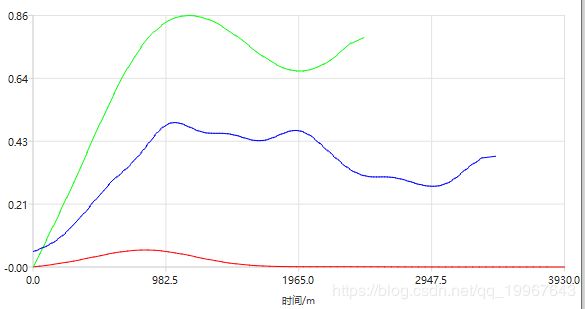
去差值+减少数据量后看起来比原始数据展示好看多了,更加简洁明了。但是还是比较生硬,需要对其平滑一下。这里采用也是最简单的“线性五点平滑”法,选取周围五点点的数据取均值。这里做了20次平滑,平滑后的效果如下:
下面是完整代码:
头文件:
#ifndef _CHART_WIDGET_H_
#define _CHART_WIDGET_H_

#include
#include
#include
#include
#include
#include

class ChartWidget : public QChartView
{
	Q_OBJECT

public:
	ChartWidget(QWidget *parent = 0);
	~ChartWidget();

	enum MMSmoothType
	{
		SMOOTH_NULL = -1,
		//拟合SIZE/200次 数据量减少10倍 平滑处理20次
		SMOOTH_200_10_20,

		//拟合SIZE/200次 数据量减少10倍 平滑处理20次
		SMOOTH_200_10_10,

		//拟合SIZE/50次 数据量减少20倍 平滑处理20次
		SMOOTH_50_20_20
	};
	void AddLineSeries(QString Name, QColor color, const QList &Datas, MMSmoothType SmoothType = SMOOTH_NULL);

	void SetAxisXRange(float Min, float Max);

	void SetAxisYRange(float Min, float Max);

	void SetAxisXTitle(QString Title);

	void SetAxisYTitle(QString Title);

	void SetTitle(QString Title);

	void SetLegendVisible(bool IsVisible);

	void SetBackgroundColor(QColor color);

	void ClearDatas();
private:

	void InitChartData();

	//线性五点拟合去差值  临近五个点去掉最大值和最小值取平均
	QList LinearFitted5(const QList& Datas);

	//线性五点平滑 临近五个点取平均
	QList LinearSmooth5(const QList& Datas);


	QList SmoothData(const QList& Datas, MMSmoothType SmoothType);
private:

	QValueAxis* m_AxisX;
	QValueAxis* m_AxisY;

	double m_MinX;
	double m_MinY;
	double m_MaxX;
	double m_MaxY;

	bool m_HasData;
};

#endif //_CHART_WIDGET_H_
源文件:
#include "ChartWidget.h"

#pragma execution_character_set("utf-8")

ChartWidget::ChartWidget(QWidget *parent)
	: QChartView(parent),
	m_MinX(0),
	m_MaxX(0),
	m_MinY(0),
	m_MaxY(0),
	m_AxisX(new QValueAxis),//sin的X轴
	m_AxisY(new QValueAxis),//sin的Y轴
	m_HasData(false)

{
	QChart* chart = this->chart();

	QFont font;
	font.setFamily("Microsoft Yahei");
	font.setPixelSize(10);
	m_AxisX->setTitleFont(font);
	m_AxisX->setLabelsFont(font);
	m_AxisX->setTitleText("时间/m");
	//m_AxisX->setLabelFormat("%0.1f");
	m_AxisX->setLabelsColor(QColor(30, 30, 30));

	//m_AxisY->setRange(-2, 2);
	m_AxisY->setTitleText("值/m");
	m_AxisY->setTitleFont(font);
	m_AxisY->setLabelsFont(font);
	m_AxisY->setLabelsColor(QColor(30, 30, 30));

	//m_AxisY->setLabelFormat("%0.1f");

	chart->legend()->setFont(font);
	chart->setTitleBrush(QColor(30, 30, 30));
	QPen p;
	p.setColor(QColor(255, 255, 255));
	chart->legend()->setPen(p);

	setRenderHint(QPainter::Antialiasing);//抗锯齿
	chart->layout()->setContentsMargins(0, 0, 0, 0);//设置外边界全部为0
	chart->setMargins(QMargins(0, 0, 0, 0));//设置内边界全部为0
	chart->setBackgroundRoundness(0);//设置背景区域无圆角

	InitChartData();

}

ChartWidget::~ChartWidget()
{
}

void ChartWidget::AddLineSeries(QString Name, QColor color, const QList &Datas, MMSmoothType SmoothType)
{
	if (Datas.size() <= 0)
	{
		return;
	}

	QList tmpData = SmoothData(Datas, SmoothType);

	QLineSeries *newSeries = new QLineSeries;
	newSeries->setColor(color);
	newSeries->setName(Name);
	QPen tmpPen(QColor(color), 1);
	newSeries->setPen(tmpPen);
	//newSeries->replace(Datas);

	for (int i = 0; i < tmpData.size(); i++)
	{
		m_MinX = m_MinX < tmpData[i].x() ? m_MinX : tmpData[i].x();
		m_MaxX = m_MaxX > tmpData[i].x() ? m_MaxX : tmpData[i].x();
		m_MinY = m_MinY < tmpData[i].y() ? m_MinY : tmpData[i].y();
		m_MaxY = m_MaxY > tmpData[i].y() ? m_MaxY : tmpData[i].y();

		newSeries->append(tmpData[i]);
	}

	QChart* chart = this->chart();
	chart->addSeries(newSeries);
	chart->setAxisX(m_AxisX, newSeries);
	chart->setAxisY(m_AxisY, newSeries);

	m_AxisX->setRange(m_MinX, m_MaxX);
	m_AxisY->setRange(m_MinY, m_MaxY);
}

void ChartWidget::SetAxisXRange(float Min, float Max)
{
	if (Min == Max)
	{
		Max++;
	}

	//取整
	int tmpMin = Min;
	if (tmpMin < Min && Min > 0)
	{
		tmpMin = Min - 1;

	}
	else if (tmpMin > Min && Min < 0)
	{
		tmpMin = Min - 1;

	}

	int tmpMax = Max;
	if (tmpMax < Max && Max > 0)
	{
		tmpMax = Max + 1;

	}
	else if (tmpMax > Max && Max < 0)
	{
		tmpMax = Max + 1;

	}

	m_MinX = tmpMin;
	m_MaxX = tmpMax;

	m_AxisX->setRange(tmpMin, tmpMax);

}

void ChartWidget::SetAxisYRange(float Min, float Max)
{
	if (Min == Max)
	{
		Max++;
	}
	//取整
	int tmpMin = Min;
	if (tmpMin < Min && Min > 0)
	{
		tmpMin = Min - 1;

	}
	else if (tmpMin > Min && Min < 0)
	{
		tmpMin = Min - 1;

	}

	int tmpMax = Max;
	if (tmpMax < Max && Max > 0)
	{
		tmpMax = Max + 1;

	}
	else if (tmpMax > Max && Max < 0)
	{
		tmpMax = Max + 1;

	}
	m_MinY = tmpMin;
	m_MaxY = tmpMax;
	m_AxisY->setRange(tmpMin, tmpMax);

}

void ChartWidget::SetAxisXTitle(QString Title)
{
	m_AxisX->setTitleText(Title);
}

void ChartWidget::SetAxisYTitle(QString Title)
{
	m_AxisY->setTitleText(Title);
}

void ChartWidget::SetTitle(QString Title)
{
	QChart* chart = this->chart();
	chart->setTitle(Title);
}

void ChartWidget::SetLegendVisible(bool IsVisible)
{
	QChart* chart = this->chart();
	chart->legend()->setVisible(IsVisible);
}

void ChartWidget::SetBackgroundColor(QColor color)
{
	QChart* chart = this->chart();
	chart->setBackgroundBrush(QBrush(color));

}

void ChartWidget::ClearDatas()
{
	QList series = this->chart()->series();
	for each (QAbstractSeries* var in series)
	{
		this->chart()->removeSeries(var);
	}

	InitChartData();
}

void ChartWidget::InitChartData()
{

	QList Datas;
	for (int i = 0; i < 3; i++)
	{
		Datas.push_back(QPointF(i, 0));
	}

	AddLineSeries("", QColor(230, 230, 230), Datas);
	m_AxisX->setRange(0, 3);
	m_AxisY->setRange(0, 1);

	m_HasData = false;
}

//自定义排序函数
bool sortByY(const QPointF &p1, const QPointF &p2)
{
	return p1.y() < p2.y();//升序排列
}


QList ChartWidget::LinearFitted5(const QList& Datas)
{
	QList result;

	if (Datas.size() <= 5)
	{
		result = Datas;
		return result;
	}
	else
	{
		int N = Datas.size();
		double tmpY;

		std::vector tmpData(5);

		int i = 0;
		for (; i < N - 5; i++)
		{
			tmpData.clear();
			for (int j = i; j < i + 5; j++)
			{
				tmpData.push_back(Datas[j]);
			}
			std::sort(tmpData.begin(), tmpData.end(), sortByY);

			tmpY = (tmpData[1].y() + tmpData[2].y() + tmpData[3].y()) / 3;
			result.push_back(QPointF(Datas[i].x(), tmpY));
		}

		result[result.size() - 1].setX(Datas[Datas.size() - 1].x());

	}

	return result;
}

QList ChartWidget::LinearSmooth5(const QList& Datas)
{
	QList result;

	if (Datas.size() <= 5)
	{
		result = Datas;
		return result;
	}
	else
	{
		int N = Datas.size();
		double tmpY;
		tmpY = (3.0 * Datas[0].y() + 2.0 * Datas[1].y() + Datas[2].y() - Datas[4].y()) / 5.0;
		if (tmpY <= 0)
		{
		tmpY = 0;
		}
		result.push_back(QPointF(Datas[0].x(), tmpY));

		tmpY = (4.0 * Datas[0].y() + 3.0 * Datas[1].y() + 2 * Datas[2].y() + Datas[3].y()) / 10.0;
		result.push_back(QPointF(Datas[1].x(), tmpY));


		for (int i = 2; i <= N - 3; i++)
		{
			tmpY = (Datas[i - 2].y() + Datas[i - 1].y() + Datas[i].y() + Datas[i + 1].y() + Datas[i + 2].y()) / 5.0;

			result.push_back(QPointF(Datas[i].x(), tmpY));

		}
		tmpY = (4.0 * Datas[N - 1].y() + 3.0 * Datas[N - 2].y() + 2 * Datas[N - 3].y() + Datas[N - 4].y()) / 10.0;
		result.push_back(QPointF(Datas[N - 2].x(), tmpY));

		tmpY  = (3.0 * Datas[N - 1].y() + 2.0 * Datas[N - 2].y() + Datas[N - 3].y() - Datas[N - 5].y()) / 5.0;
		result.push_back(QPointF(Datas[N - 1].x(), tmpY));

	}

	return result;
}

QList ChartWidget::SmoothData(const QList& Datas, MMSmoothType SmoothType)
{
	if (Datas.size() < 5)
	{
		return Datas;
	}

	QList tmpDatas = Datas;

	int param1, param2, param3;
	switch (SmoothType)
	{
	case ChartWidget::SMOOTH_NULL:
		return tmpDatas;
		break;
	case ChartWidget::SMOOTH_200_10_20:
		param1 = 200;
		param2 = 10;
		param3 = 20;
		break;
	case ChartWidget::SMOOTH_200_10_10:
		param1 = 200;
		param2 = 1;
		param3 = 10;
		break;
	case ChartWidget::SMOOTH_50_20_20:
		param1 = 50;
		param2 = 20;
		param3 = 20;

		break;
	default:
		break;
	}

	int smoothCount = Datas.size() / param1 + 1;
	for (int i = 0; i < smoothCount; i++)
	{
		tmpDatas = LinearFitted5(tmpDatas);
	}

	QList  result;
	for (int i = 0; i < tmpDatas.size(); )
	{
		result.push_back(tmpDatas.at(i));
		i += param2;

	}
	result.push_back(tmpDatas.at(tmpDatas.size() - 1));


	for (int i = 0; i < param3; i++)
	{
		result = LinearSmooth5(result);

	}
	return result;
}
调用方式:
	QList data0 = ReadDatas("data0.txt");
	QList data1 = ReadDatas("data1.txt");
	QList data2 = ReadDatas("data2.txt");

	ChartWidget* tmpChart = new ChartWidget(this);

	//QHBoxLayout* mainLayout = new QHBoxLayout(tmpChart);
	//this->setLayout(mainLayout);
	this->setCentralWidget(tmpChart);

	tmpChart->AddLineSeries("", QColor(255, 0, 0), data0, ChartWidget::SMOOTH_200_10_20);
	tmpChart->AddLineSeries("", QColor(0, 255, 0), data1, ChartWidget::SMOOTH_200_10_20);
	tmpChart->AddLineSeries("", QColor(0, 0, 255), data2, ChartWidget::SMOOTH_200_10_20);
完整代码 CSDN链接下载需要积分,不知道怎么取消积分。
用百度云:链接: https://pan.baidu.com/s/1lVjeWracw1z5NPl8-3FYIA 提取码: yak8


