matplotlib.pyplot子库(一):plot()、figure
一:认识pyplot
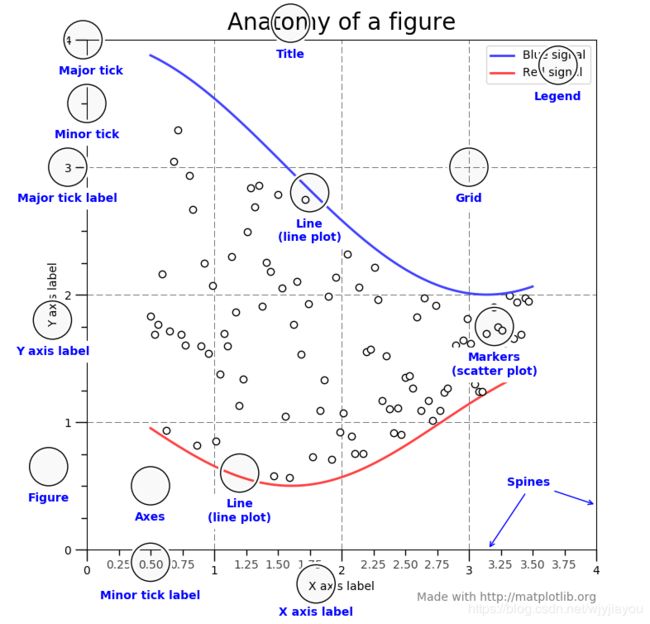
pyplot能通过的简单的函数制作出可视化的图,图中含有很多子元素,包括画布(figure)、轴(axes)、线(line)、图例(legend)、标题、标度……,然后在掌握这些函数的基础上,按照自己的构思做出自己的可视化作品就算是达到了初步的目的。
#导入相关包,进行设置
import matplotlib.pyplot as plt
import numpy as np
%matplotlib inline #魔法命令适合ipython使用用来显示图,或者使用plt.show()
plt.rcParams['font.sans-serif'] = ['SimHei']  #用来正常显示中文,字体黑体
plt.rcParams['axes.unicode_minus'] = False   #用来正常显示正负号
二:画布(figure)
plt.figure()  #创建figure对象

figurenum=None, figsize=None, dpi=None, facecolor=None, edgecolor=None,
frameon=True, FigureClass=, clear=False, **kwargs)
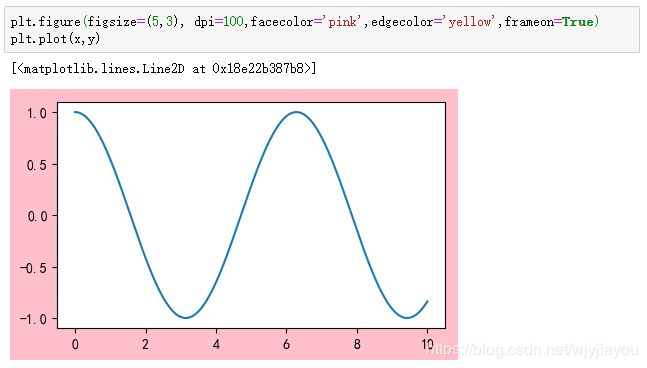
figure对象时后续绘画操作的总容器。matplotlib一般会默认创建,但是事先创建的figure对象则可以对它进行更加精细的设定。
- num:可选参数,指定图像编号或名称,整型微编号,字符串为名称;
- figsize:可选参数,指定figure的宽和高,单位:英寸(2.54cm=1英寸)
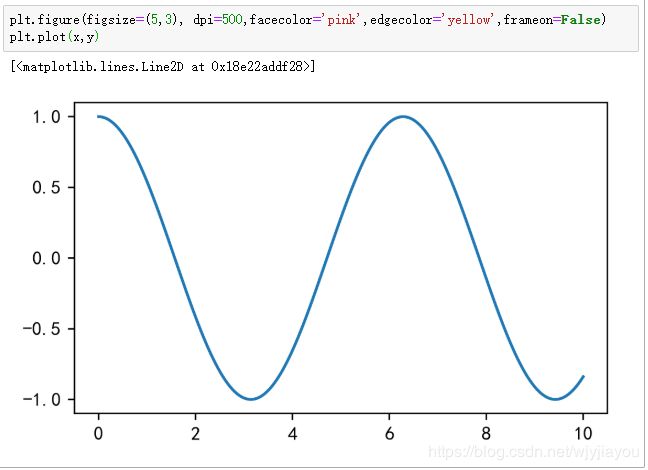
- dpi :整型,调整图形分辨率;缺省值100;
- facecolor: 背景颜色;默认白色
- edgecolor: 边界颜色;默认白色
- frameon: bool,默认True;False,不显示图形框
- FigureClass: 使用自定义的matplotlib.figure.Figure类
- clear= False:图形已存在时是否清除原有对象,如果参数为True,并且该窗口存在的话,清除该窗口的内容
注意,相同的figsize,dpi越大图越大;frameon的作用
三:plot()函数
使用方法:
- plot(x,y)
- plot(x,y,'标注')
- plot(y)
- plot(y,'标注')
举例:plot(x,y)
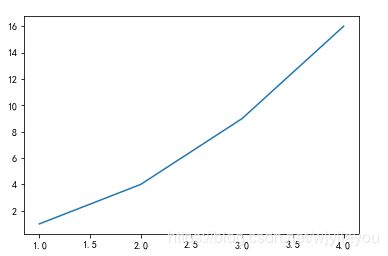
plt.plot([1,2,3,4],[1,4,9,16])举例:plot(y)
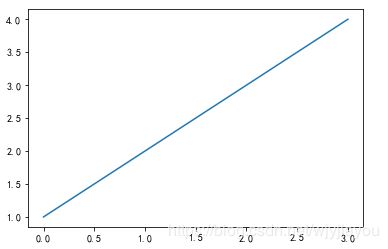
plt.plot([1,2,3,4])
Format String:
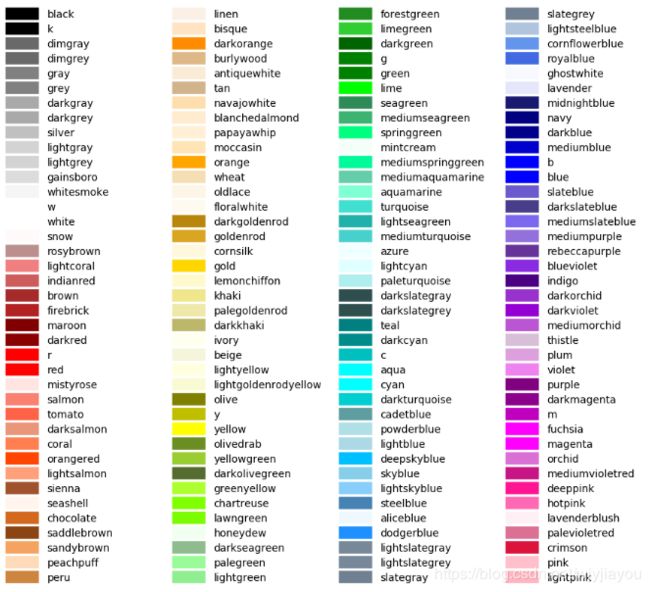
包括颜色、标注marker、线的风格linestyle
fmt = '[color][marker][line]'颜色(color)
| character | color |
|---|---|
| 'b' | blue |
| 'g' | green |
| 'r' |
red |
| 'c' | cyan(青绿色) |
| 'm' | magenta(洋红色) |
| 'y' | yellow |
| 'k' | black |
| 'w' | white |
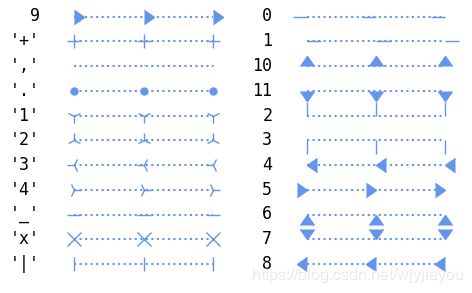
标记(markers)
linestyle
宽度(linewidth)、透明的(alpha)、描点方式(drawstyle)
宽度可取任意值;透明度一帮取值[0,1];
drawstyles:{'default','steps','steps-pre','steps-mid','steps-post'}
x=np.linspace(1,10,10)
y=np.sin(y)
fig=plt.figure(dpi=500)
ax1=fig.add_subplot(221) #2*2的图形 在第一个位置
ax1.plot(x,y,'rv:',lw = 3, alpha = 0.8,drawstyle = 'steps')
ax2=fig.add_subplot(222)
ax2.plot(x,y,'rv:',lw = 2, alpha = 0.4,drawstyle = 'steps-pre')
ax3=fig.add_subplot(223)
ax3.plot(x,y,'rv:',lw = 3, alpha = 0.8,drawstyle = 'steps-mid')
ax3=fig.add_subplot(224)
ax3.plot(x,y,'rv:',lw = 3, alpha = 0.8,drawstyle = 'steps-post')
