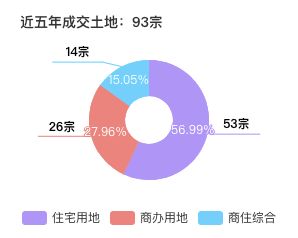
例1:
show:

code:
let opt = {
title: {
text: `近五年成交土地:${data.land.total}宗`,
left: 16,
top: 10,
textStyle: {
color: "#333",
fontSize: 14
}
},
legend: {
bottom: 10,
orient: "horizontal",
data: []
},
color: ["#B692FC", "#FE7D78", "#51D1FF"],
series: [
{
name: "",
type: "pie",
radius: ["20%", "50%"],
hoverAnimation: false,
data: landPieData,
label: {
show: true,
padding: [0, -40, 20],
fontSize: 12,
fontWeight: 600,
color: "#000000",
formatter: function(p) {
return `${p.value}宗`;
}
},
labelLine: {
show: true,
length: 5,
length2: 50
}
},
{
name: "土地统计",
type: "pie",
radius: ["20%", "50%"],
hoverAnimation: false,
label: {
show: true,
position: "inner",
formatter: function(p) {
return `${p.percent}%`;
}
},
data: []
}
]
}
例2:
show:

code:
let opt = {
title: {
text: `近五年成交土地:${data.land.total}宗`,
left: 16,
top: 10,
textStyle: {
color: "#333",
fontSize: 14
}
},
legend: {
bottom: 10,
orient: "horizontal",
data: []
},
color: ["#B692FC", "#FE7D78", "#51D1FF"],
series: [
{
name: "",
type: "pie",
radius: ["20%", "50%"],
hoverAnimation: false,
label: {
show: true,
padding: [20, -40, 20],
fontSize: 12,
fontWeight: 600,
color: "#000000",
formatter: function(p) {
return `${p.value}宗\n\n${p.percent}%`;
}
},
labelLine: {
show: true,
length: 5,
length2: 50
},
data: []
}
]
}

