Python数字图像处理——OpenCV实例解析
目录
读取图像
修改像素值
图像融合
图像的几何变换
简单阈值
自适应阈值——用于解决光照问题
Otsu's Binarization二值化
调用摄像头
读取视频
保存视频
OpenCV绘图
设置鼠标事件
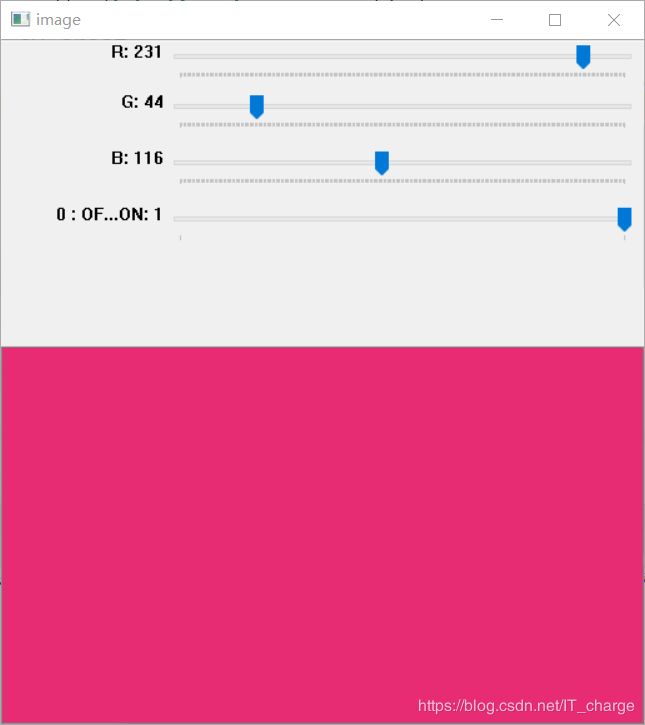
轨迹栏应用
图像的三通道抽取与合并
展示边框的使用
实现跟踪视频中的指定彩色物体
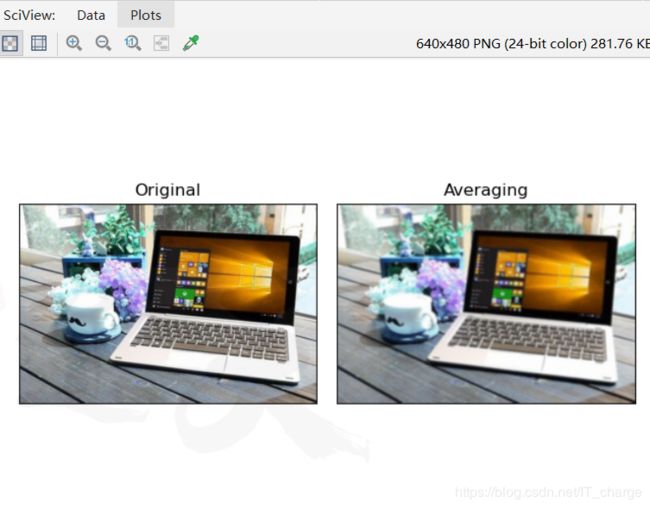
图像模糊(图像平滑)与2D卷积
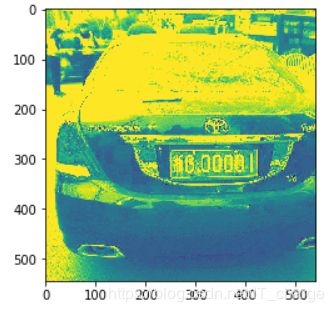
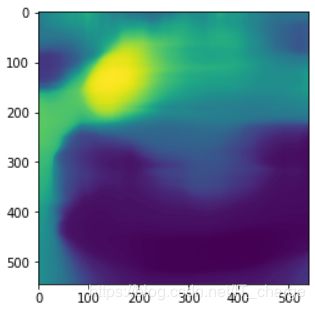
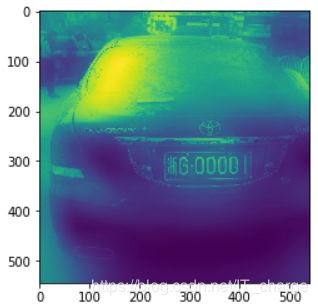
感受光照的影响
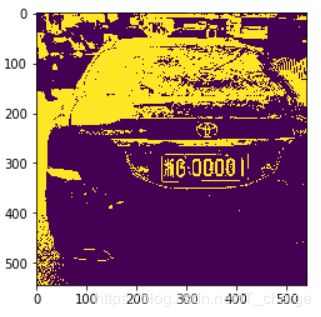
二值化处理
自定义阈值处理
图像模糊 平滑图像
边缘检测
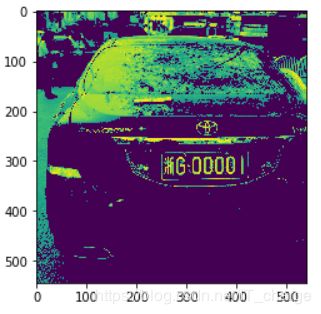
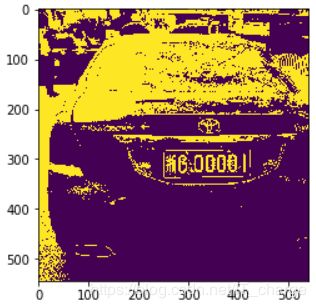
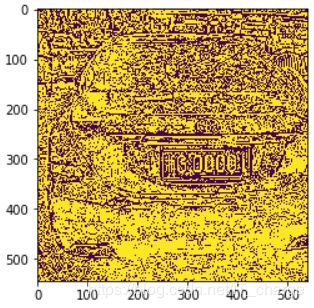
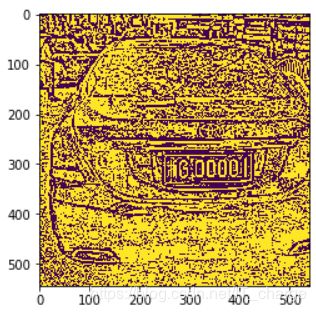
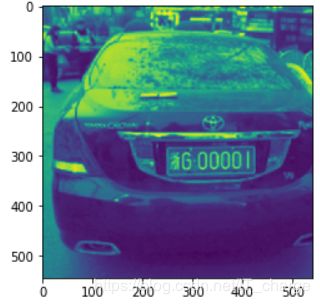
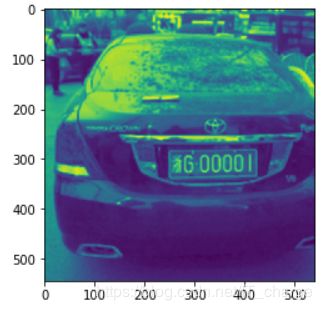
实现车牌提取
形态转换
结构元素内核
查找图像渐变、边缘
使用Haar级联分类器实现人脸检测和眼睛检测
简单使用模板匹配
基于ORB的匹配器
读取图像
import cv2 as cv

# 读取彩色图像
img_cai = cv.imread("E:/1.png")
# 读取灰度图像
img_hui = cv.imread("E:/1.png",cv.IMREAD_GRAYSCALE)

print(img_cai.shape)
print(img_hui.shape)

# 注意:opencv读取的彩色图像默认的颜色是BGR matplotlib默认的彩色图像是RGB
import matplotlib.pyplot as plt
plt.imshow(img_cai)                    # 全图展示
plt.imshow(img_cai[30:160,200:320])    # 截取部分

# 保存图像
cv.imwrite("duqu.png",img_cai[30:160,200:320])
修改像素值
# 修改像素值
img[30:50,:] = [255,0,0]
plt.imshow(img)
图像融合
import cv2 as cv
import numpy as np
from matplotlib import pyplot as plt

img1 = cv.imread('E:/4.png')
img2 = cv.imread('E:/3.png')

dst = cv.addWeighted(img1,0.7,img2[:233,:230,:],0.3,0)

cv.imshow('Original Image 1', img1)
cv.imshow('Original Image 2', img2)
cv.imshow('Fusion Image', dst)
cv.waitKey(0)
cv.destroyAllWindows()
图像的几何变换
import cv2 as cv
import numpy as np
from matplotlib import pyplot as plt

lq = cv.imread('E:/6.png')
# 调整图片大小
i2 = cv.resize(lq,(200,500),interpolation=cv.INTER_CUBIC)
# 平移图片
M = np.float64([[1,0,100],[0,1,50]])
i3 = cv.warpAffine(lq,M,(300,300))
# 图片的旋转
M = cv.getRotationMatrix2D((250,250),30,1)
i4 = cv.warpAffine(lq,M,(300,300))
# 图片的倾斜
d1 = np.float32([[100,10],[300,10],[100,100]])
d2 = np.float32([[100,30],[200,30],[150,100]])
M = cv.getAffineTransform(d1,d2)
i5 = cv.warpAffine(lq,M,(300,300))
# 透视变化
d1 = np.float32([[100,100],[400,100],[100,400],[400,400]])
d2 = np.float32([[200,200],[300,200],[200,300],[300,300]])
d3 = np.float32([[0,0],[500,0],[500,0],[0,500]])
M = cv.getPerspectiveTransform(d1,d2)
i6 = cv.warpPerspective(lq,M,(300,300))
cv.imshow('Original Image', lq)
cv.imshow('Sizing Image', i2)
cv.imshow('Translation Image', i3)
cv.imshow('Rotate Image', i4)
cv.imshow('Tilt Image', i5)
cv.imshow('Perspective change Image', i6)
cv.waitKey(0)
cv.destroyAllWindows()
简单阈值
import cv2 as cv
import numpy as np
from matplotlib import pyplot as plt

img = cv.imread('E:/4.png',0)
ret,thresh1 = cv.threshold(img,127,255,cv.THRESH_BINARY)
ret,thresh2 = cv.threshold(img,127,255,cv.THRESH_BINARY_INV)
ret,thresh3 = cv.threshold(img,127,255,cv.THRESH_TRUNC)
ret,thresh4 = cv.threshold(img,127,255,cv.THRESH_TOZERO)
ret,thresh5 = cv.threshold(img,127,255,cv.THRESH_TOZERO_INV)

titles = ['Original Image', 'BINARY','BINARY_INV','TRUNC','TOZERO','TOZERO_INV']
images = [img,thresh1,thresh2,thresh3,thresh4,thresh5]

for i in range(6):
    plt.subplot(2,3,i+1),plt.imshow(images[i],'gray')
    plt.title(titles[i])
    plt.xticks([]),plt.yticks([])
plt.show()

cv.imshow('Original Image',img)
cv.waitKey(0)
cv.destroyAllWindows()
自适应阈值——用于解决光照问题
cv.ADAPTIVE_THRESH_MEAN_C:该阈值是平均值的附近区域减去恒定的Ç。
cv.ADAPTIVE_THRESH_GAUSSIAN_C:阈值是邻域值减去常数C的高斯加权和。
# 用于解决光照问题
import cv2 as cv
from matplotlib import pyplot as plt

img = cv.imread('E:/3.png',0)

#常用来去除椒盐噪声
#卷积核使用奇数
blur=cv.medianBlur(img,5)

ret,th1 = cv.threshold(img,127,255,cv.THRESH_BINARY)
# cv.ADAPTIVE_THRESH_MEAN_C:该阈值是平均值的附近区域减去恒定的Ç。
th2 = cv.adaptiveThreshold(img,255,cv.ADAPTIVE_THRESH_MEAN_C,cv.THRESH_BINARY,11,2)
# cv.ADAPTIVE_THRESH_GAUSSIAN_C:阈值是邻域值减去常数C的高斯加权和。
th3 = cv.adaptiveThreshold(img,255,cv.ADAPTIVE_THRESH_GAUSSIAN_C,cv.THRESH_BINARY,11,2)

titles = ['Original Image', 'Global Thresholding(v=127)','Adaptive Mean Thresholding','Adaptive Gaussian Thresholding']
images = [img,th1,th2,th3]

for i in range(4):
    plt.subplot(2,2,i+1),plt.imshow(images[i],'gray')
    plt.title(titles[i])
    plt.xticks([]),plt.yticks([])
plt.show()

cv.imshow('medianBlur',blur)
cv.waitKey(0)
cv.destroyAllWindows()
Otsu's Binarization二值化
import cv2 as cv
import numpy as np
from matplotlib import pyplot as plt

img = cv.imread('E:/5.png',0)

# global thresholding
ret1,th1 = cv.threshold(img,127,255,cv.THRESH_BINARY)

# Otsu's thresholding
ret2,th2 = cv.threshold(img,0,255,cv.THRESH_BINARY+cv.THRESH_OTSU)

# Otsu's thresholding after Gaussian filtering
blur = cv.GaussianBlur(img,(5,5),0)
ret3,th3 = cv.threshold(blur,0,255,cv.THRESH_BINARY+cv.THRESH_OTSU)

# plot all the image and their histograms
images = [img, 0, th1,
          img, 0, th2,
          blur, 0, th3]
titles = ['Original Noisy Image','Histogram','Global Thresholding(v=127)',
          'Original Noisy Image','Histogram',"Otsu's Thresholding",
          'Gaussian filtered Image','Histogram',"Otsu's Thresholding" ]

for i in range(3):
    plt.subplot(3,3,i*3+1),plt.imshow(images[i*3],'gray')
    plt.title(titles[i*3]),plt.xticks([]),plt.yticks([])
    plt.subplot(3,3,i*3+2),plt.hist(images[i*3].ravel(),256)
    plt.title(titles[i*3+1]),plt.xticks([]), plt.yticks([])
    plt.subplot(3,3,i*3+3),plt.imshow(images[i*3+2], 'gray')
    plt.title(titles[i*3+2]),plt.xticks([]), plt.yticks([])
plt.show()

cv.imshow('Original Image',img)
cv.waitKey(0)
cv.destroyAllWindows()
调用摄像头
import numpy as np
import cv2 as cv

cap = cv.VideoCapture(0)
if not cap.isOpened():
    print("Cannot open camera")
    exit()
while True:
    # Capture frame-by-frame
    ret,frame = cap.read()

    # if frame is read correctly ret is True
    if not ret:
        print("Can't receive frame (stream end?). Exiting...")
        break
    # Our operations on the frame come here
    gray = cv.cvtColor(frame, cv.COLOR_RGB2RGBA)
    # Display the resulting frame
    cv.imshow('frame', gray)
    if cv.waitKey(1) == ord('q'):
        break

# When everything done, release the capture
cap.release()
cv.destroyAllWindows()
读取视频
import numpy as np
import cv2 as cv

cap = cv.VideoCapture('F:/video.mp4')

while cap.isOpened():
    ret,frame = cap.read()

    # if frame is read correctly ret is True
    if not ret:
        print("Can't receive frame(stream end?).Exiting...")
        break
    gray = cv.cvtColor(frame,cv.COLOR_BGR2GRAY)
    cv.imshow('frame',gray)
    if cv.waitKey(1) == ord('q'):
        break

cap.realease()
cv.destroyAllWindows()
保存视频
# •保存视频
cap = cv.VideoCapture("data/movbbb.mp4")

fourcc = cv.VideoWriter_fourcc(*"MJPG")
out = cv.VideoWriter("movie.mp4",-1,20,(320,176))

while True:
    # 读取每一帧的数据
    b,frame = cap.read()
    #根据返回值是b来决定是不是还有下一帧
    if b==False:
        break
    #输出保存
    out.write(frame)
    #展示一帧的数据
    cv.imshow("1.jpg",frame)
    #设置如果按键等于q键 就退出
    if cv.waitKey(1) == ord('q'):
        break
#销毁 窗口
cap.release()
out.release()
cv.destroyAllWindows()
OpenCV绘图
import numpy as np
import cv2 as cv
# Create a black image
img = np.zeros((512,512,3), np.uint8)                       # 设置黑色的背景

# Draw a diagonal blue line with thickness of 5 px
cv.line(img,(0,0),(511,511),(255,0,0),5)             # 画线
cv.rectangle(img,(384,0),(510,128),(0,255,0),3) # 画矩形
cv.circle(img,(447,63), 63, (0,0,255), -1)         # 画圆
font = cv.FONT_HERSHEY_SIMPLEX                              # 画文字图片
cv.putText(img,'OpenCV',(10,500), font, 4,(255,255,255),2,cv.LINE_AA)

cv.imshow('Final Image', img)
cv.waitKey(0)
cv.destroyAllWindows()
设置鼠标事件
import cv2 as cv
import numpy as np

# 查看常见事件
events = [i for i in dir(cv) if 'EVENT' in i]
print(events)

# 鼠标双击画图
# mouse callback function
def draw_circle(event,x,y,flags,param):
    if event == cv.EVENT_LBUTTONDBLCLK:
        cv.circle(img,(x,y),100,(255,0,0),-1)

# Create a black image, a window and bind the dunction to window
img = np.zeros((512,512,3), np.uint8)
cv.namedWindow('image')
cv.setMouseCallback('image', draw_circle)

while(1):
    cv.imshow('image', img)
    if cv.waitKey(20) & 0xFF == 27:
        break
cv.destroyAllWindows()
轨迹栏应用
import numpy as np
import cv2 as cv

def nothing(x):
    pass

# Create a black image , a window
img = np.zeros((300,512,3), np.uint8)
cv.namedWindow('image')

# create trackbars for color change
cv.createTrackbar('R', 'image', 0,255, nothing)
cv.createTrackbar('G', 'image', 0,255, nothing)
cv.createTrackbar('B', 'image', 0,255, nothing)

# create switch for ON/OFF functionality
switch = '0 : OFF \n1 : ON'
cv.createTrackbar(switch, 'image', 0,1, nothing)

while(1):
    cv.imshow('image', img)
    k = cv.waitKey(1) & 0xFF
    if k == 27:
        break

    # get current positions of fore trackbars
    r = cv.getTrackbarPos('R', 'image')
    g = cv.getTrackbarPos('G', 'image')
    b = cv.getTrackbarPos('B', 'image')
    s = cv.getTrackbarPos(switch, 'image')

    if s == 0:
        img[:] = 0
    else:
        img[:] = [b,g,r]

cv.destroyAllWindows()
图像的三通道抽取与合并
img = cv.imread("data/3.jpg")
b,g,r = cv.split(img)
img2 = cv.merge([r,g,b])
plt.imshow(img2)
展示边框的使用
- src-输入图像
- 顶部,底部,左侧,右侧边界的宽度,以相应方向上的像素数为单位
- borderType-定义要添加哪种边框的标志。它可以是以下类型:
- cv.BORDER_CONSTANT-添加恒定的彩色边框。该值应作为下一个参数给出。
- cv.BORDER_REFLECT-边框将是边框元素的镜像,如下所示: fedcba | abcdefgh | hgfedcb
- cv.BORDER_REFLECT_101或 cv.BORDER_DEFAULT-与上述相同,但略有变化,例如: gfedcb | abcdefgh | gfedcba
- cv.BORDER_REPLICATE-最后一个元素被复制,像这样: aaaaaa | abcdefgh | hhhhhhh
- cv.BORDER_WRAP-无法解释,它看起来像这样: cdefgh | abcdefgh | abcdefg
- 价值 -边框颜色,如果边框类型为cv.BORDER_CONSTANT
import cv2 as cv
import numpy as np
from matplotlib import pyplot as plt

BLUE = [255,0,0]

img = cv.imread("E:/9.png")

rep = cv.copyMakeBorder(img,10,10,10,10,cv.BORDER_REPLICATE)
warp = cv.copyMakeBorder(img,10,10,10,10,cv.BORDER_WRAP)
ref = cv.copyMakeBorder(img,0,100,0,0,cv.BORDER_REFLECT)
cons = cv.copyMakeBorder(img,10,10,10,10,cv.BORDER_CONSTANT,value=(255,0,0))
ref101 = cv.copyMakeBorder(img,10,10,10,10,cv.BORDER_REFLECT101)

plt.imshow(img)
plt.imshow(ref)

plt.subplot(231),plt.imshow(img,"gray"),plt.title("YUAN")
plt.subplot(232),plt.imshow(rep,"gray"),plt.title("REP")
plt.subplot(233),plt.imshow(warp,"gray"),plt.title("WARP")
plt.subplot(234),plt.imshow(ref,"gray"),plt.title("REF")
plt.subplot(235),plt.imshow(cons,"gray"),plt.title("CONS")
plt.subplot(236),plt.imshow(ref101,"gray"),plt.title("REF101")
plt.show()
实现跟踪视频中的指定彩色物体
转换色彩空间 :i2 = cv.cvtColor(img,cv.COLOR_BGR2GRAY)
跟踪彩色物体
- 拍摄视频的每一帧
- 从BGR转换为HSV颜色空间
- 我们将HSV图片的阈值范围设为蓝色
- 现在仅提取蓝色对象,我们就可以在该图像上执行任何操作
import cv2 as cv
import numpy as np
import time

cap = cv.VideoCapture("F:/video.mp4")

while True:
    b, frame = cap.read()

    if not b:
        break;

    if cv.waitKey(1) == ord("q"):
        break

    time.sleep(0.1)
    # 将原来的BGR数据转换 HSV数据
    hsv = cv.cvtColor(frame, cv.COLOR_BGR2HSV)
    # 设置紫色的最大值和最小值
    lower_hsv = np.array([125, 43, 46])
    upper_hsv = np.array([155, 255, 255])
    # 判断原图中哪些是紫色
    mask = cv.inRange(hsv, lower_hsv, upper_hsv)
    # 展示
    res = cv.bitwise_and(frame, frame, mask=mask)

    cv.imshow("1.jpg", frame)
    cv.imshow("mask.jpg", mask)
    cv.imshow("res.jpg", res)

cap.release()
cv.destroyAllWindows()
图像模糊(图像平滑)与2D卷积
import numpy as np
import cv2 as cv
from matplotlib import pyplot as plt

img = cv.imread('E:/10.png')

kernel = np.ones((5,5),np.float32)/25
dst = cv.filter2D(img,-1,kernel)

plt.subplot(121),plt.imshow(img),plt.title('Original')
plt.xticks([]),plt.yticks([])
plt.subplot(122),plt.imshow(dst),plt.title('Averaging')
plt.xticks([]),plt.yticks([])
plt.show()
感受光照的影响
二值化处理
data = cv.imread("timg.jpg",cv.IMREAD_GRAYSCALE)
plt.imshow(cv.threshold(data,127,255,cv.THRESH_BINARY)[1])
plt.imshow(cv.threshold(data,127,255,cv.THRESH_TRUNC)[1])
plt.imshow(cv.threshold(data,127,255,cv.THRESH_TOZERO)[1])
plt.imshow(cv.threshold(data,127,255,cv.THRESH_OTSU)[1])
自定义阈值处理
plt.imshow(cv.adaptiveThreshold(data,127,cv.ADAPTIVE_THRESH_GAUSSIAN_C,cv.THRESH_BINARY,11,2))
plt.imshow(cv.adaptiveThreshold(data,127,cv.ADAPTIVE_THRESH_MEAN_C,cv.THRESH_BINARY,11,2))
图像模糊 平滑图像
plt.imshow(cv.blur(data,(5,5)))
plt.imshow(cv.GaussianBlur(data,(5,5),30))
plt.imshow(cv.medianBlur(data,127))
plt.imshow(cv.bilateralFilter(data,100,100,100))
plt.imshow(data)
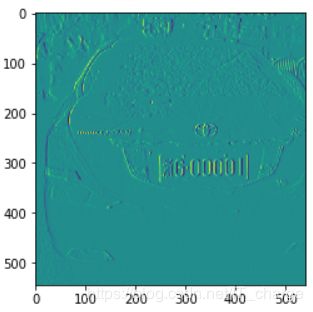
边缘检测
- 拉普拉斯
plt.imshow(cv.Laplacian(data,cv.CV_32F))
- Sobel
plt.imshow(cv.Sobel(data,cv.CV_64F,1,0,ksize=5))
- 坎尼边缘检测
plt.imshow(cv.Canny(data,100,200))
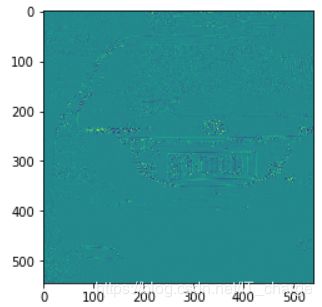
实现车牌提取
import cv2 as cv
import matplotlib.pyplot as plt

# 读取彩色的图片
img = cv.imread("E:/chepai.png")
# 转换为灰度图
img1 = cv.cvtColor(img,cv.COLOR_BGR2GRAY)
# 高斯模糊
img2 = cv.GaussianBlur(img1,(5,5),10)
# Laplacian进行边缘检测
img3 = cv.Sobel(img2,cv.CV_8U,1,0,ksize=1)
img4 = cv.Canny(img3,250,100)
# 进行二值化处理
i,img5 = cv.threshold(img4,0,255,cv.THRESH_BINARY)
# 可以侵蚀和扩张
kernel = cv.getStructuringElement(cv.MORPH_RECT,(43,33))
img6 = cv.dilate(img5,kernel)
# 循环找到所有的轮廓
i,j = cv.findContours(img6,cv.RETR_TREE,cv.CHAIN_APPROX_SIMPLE)
result = None
for i1 in i:
    x,y,w,h = cv.boundingRect(i1)
    if w>2*h:
        print(1)
        plt.imshow(img[y:y+h,x:x+w])
        result = img[y:y+h,x:x+w]

plt.show()
形态转换
- erosion = cv.erode(img,kernel,iterations = 1) 1.侵蚀
- dilation = cv.dilate(img,kernel,iterations = 1) 2.扩张
- opening = cv.morphologyEx(img, cv.MORPH_OPEN, kernel) 3.开场
- closing = cv.morphologyEx(img, cv.MORPH_CLOSE, kernel) 4.闭幕
- gradient = cv.morphologyEx(img, cv.MORPH_GRADIENT, kernel) 5.形态梯度
- tophat = cv.morphologyEx(img, cv.MORPH_TOPHAT, kernel) 6.高顶礼帽
- blackhat = cv.morphologyEx(img, cv.MORPH_BLACKHAT, kernel) 7.黑帽
结构元素内核
- 矩形内核 cv.getStructuringElement(cv.MORPH_RECT,(5,5))
- 椭圆形内核 cv.getStructuringElement(cv.MORPH_ELLIPSE,(5,5))
- 十字形内核 cv.getStructuringElement(cv.MORPH_CROSS,(5,5))
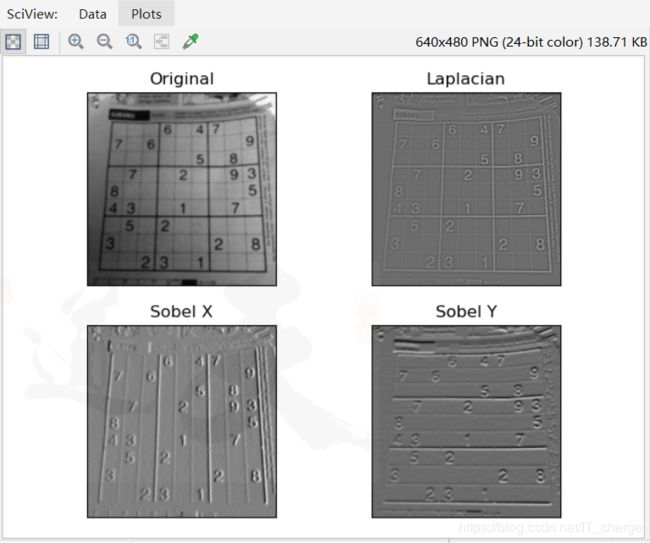
查找图像渐变、边缘
import numpy as np
import cv2 as cv
from matplotlib import pyplot as plt

img = cv.imread('E:/3.PNG', 0)

laplacian = cv.Laplacian(img, cv.CV_64F)
sobelx = cv.Sobel(img, cv.CV_64F, 1,0, ksize=5)
sobely = cv.Sobel(img, cv.CV_64F, 0,1, ksize=5)

plt.subplot(2,2,1), plt.imshow(img, cmap='gray')
plt.title('Original'), plt.xticks([]), plt.yticks([])
plt.subplot(2,2,2), plt.imshow(laplacian, cmap='gray')
plt.title('Laplacian'), plt.xticks([]), plt.yticks([])
plt.subplot(2,2,3), plt.imshow(sobelx, cmap='gray')
plt.title('Sobel X'), plt.xticks([]), plt.yticks([])
plt.subplot(2,2,4), plt.imshow(sobely, cmap='gray')
plt.title('Sobel Y'), plt.xticks([]), plt.yticks([])

plt.show()
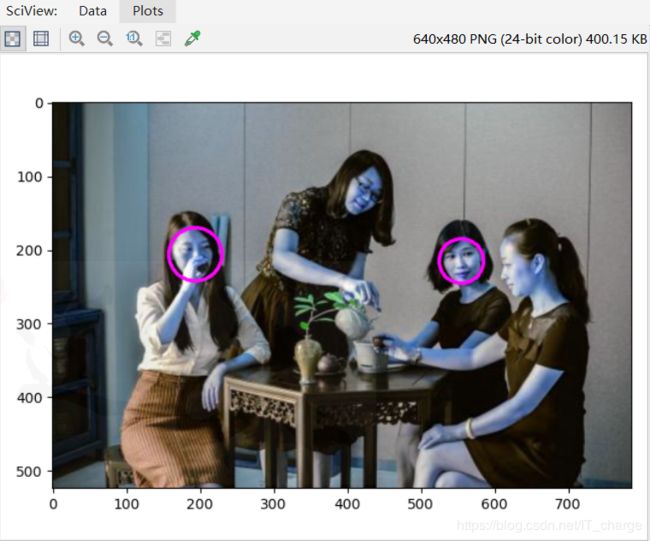
使用Haar级联分类器实现人脸检测和眼睛检测
import cv2 as cv
from matplotlib import pyplot as plt

m = cv.imread(r'E:\together.png')

face = cv.CascadeClassifier()
eye = cv.CascadeClassifier()

face.load(r"E:\software\python3.8.2\Lib\site-packages\cv2\data\haarcascade_frontalface_default.xml")
eye.load(r"E:\software\python3.8.2\Lib\site-packages\cv2\data\haarcascade_eye.xml")

maray = cv.cvtColor(m, cv.COLOR_BGR2GRAY)
faces = face.detectMultiScale(maray)

for (x,y,w,h) in faces:
    center = (x + w//2, y + h//2)
    m = cv.ellipse(m, center, (w//2, h//2), 0, 0, 360, (255, 0, 255), 4)
    faceROI = maray[y:y+h,x:x+w]

plt.imshow(m)
plt.show()
简单使用模板匹配
import numpy as np
import cv2 as cv

# ROI值先写  目标对象值先写
h = cv.imread("E:/h.png")
# 被搜索图片
hua = cv.imread("E:/hua.png")
huagray = cv.cvtColor(hua, cv.COLOR_BGR2GRAY)
hgray = cv.cvtColor(h, cv.COLOR_BGR2GRAY)

res = cv.matchTemplate(huagray, hgray, cv.TM_CCOEFF_NORMED)

threshold = 0.6
loc = np.where(res >= threshold)
for i in zip(*loc[::-1]):
    cv.rectangle(hua, i, (i[0]+158, i[1]+131), (0,0,255), 2)

cv.imwrite('E:/res.png', hua)
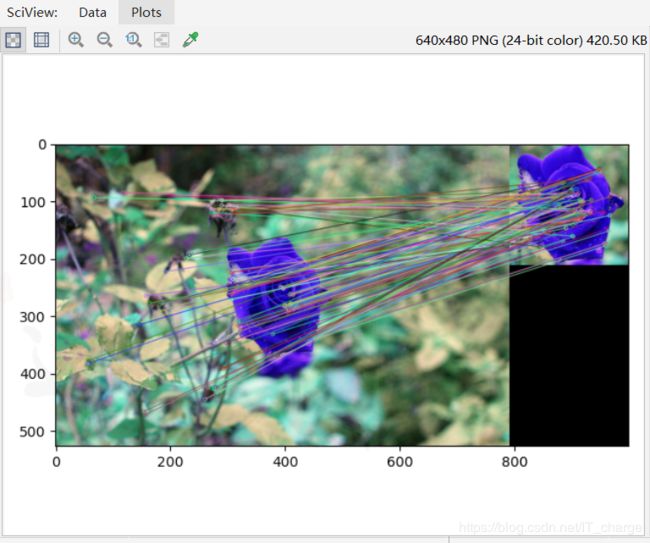
基于ORB的匹配器
import numpy as np
import cv2 as cv
from matplotlib import pyplot as plt

# ROI值先写  目标对象值先写
h = cv.imread("E:/h.png")
# 被搜索图片
hua = cv.imread("E:/hua.png")

orb = cv.ORB_create()

huakp,huades = orb.detectAndCompute(hua, None)
hkp,hdes = orb.detectAndCompute(h, None)

bf = cv.BFMatcher(cv.NORM_HAMMING, crossCheck=True)

matchers = bf.match(huades,hdes)

matches = sorted(matchers, key=lambda x:x.distance)

im = cv.drawMatches(hua, huakp, h, hkp, matches, None, flags=cv.DrawMatchesFlags_NOT_DRAW_SINGLE_POINTS)

plt.imshow(im)
plt.show()


