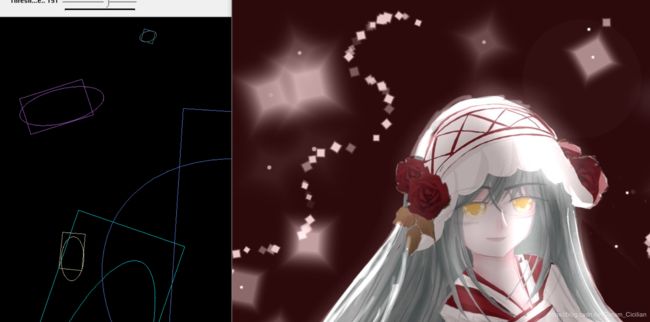
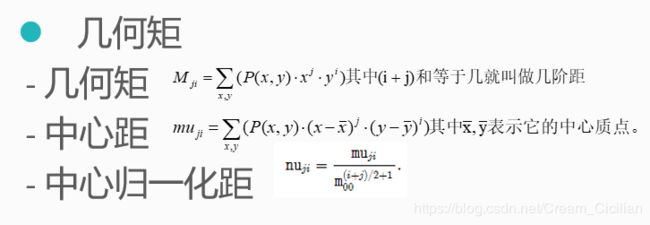
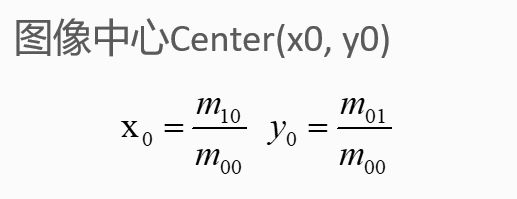
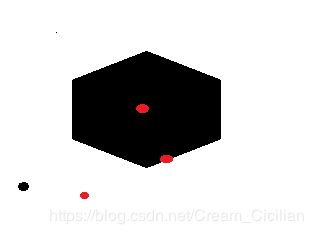
轮廓发现是基于图像边缘提取的基础寻找对象轮廓的方法。
所以边缘提取的阈值选定会影响最终轮廓发现结果
API介绍
findContours发现轮廓
drawContours绘制轮廓
在二值图像上发现轮廓使用API cv::findContours(
InputOutputArray binImg, // 输入图像,非0的像素被看成1,0的像素值保持不变,8-bit
OutputArrayOfArrays contours,// 全部发现的轮廓对象
OutputArray, hierachy// 图该的拓扑结构,可选,该轮廓发现算法正是基于图像拓扑结构实现。
int mode, // 轮廓返回的模式
int method,// 发现方法
Point offset=Point()// 轮廓像素的位移,默认(0, 0)没有位移
)
在二值图像上发现轮廓使用API cv::findContours之后对发现的轮廓数据进行绘制显示
drawContours(
InputOutputArray binImg, // 输出图像
OutputArrayOfArrays contours,// 全部发现的轮廓对象
Int contourIdx// 轮廓索引号
const Scalar & color,// 绘制时候颜色
int thickness,// 绘制线宽
int lineType ,// 线的类型LINE_8
InputArray hierarchy,// 拓扑结构图
int maxlevel,// 最大层数, 0只绘制当前的,1表示绘制绘制当前及其内嵌的轮廓
Point offset=Point()// 轮廓位移,可选
输入图像转为灰度图像cvtColor
使用Canny进行边缘提取,得到二值图像
使用findContours寻找轮廓
使用drawContours绘制轮廓
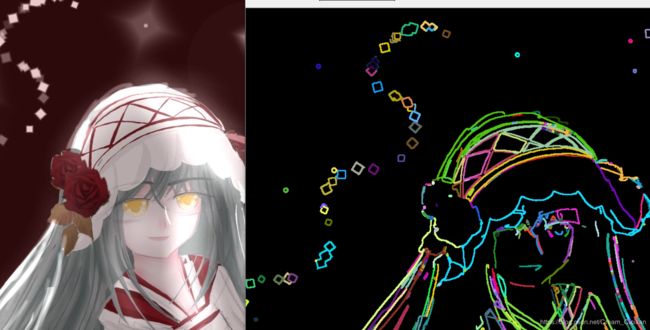
#include
#include
#include
using namespace std;
using namespace cv;
Mat src, dst;
const char* output_win = "findcontours-demo";
int threshold_value = 100;
int threshold_max = 255;
RNG rng;
void Demo_Contours(int, void*);
int main(int argc, char** argv) {
src = imread("C:/Users/Admin/Desktop/1.jpg");
if (src.empty()) {
printf("could not load image...\n");
return -1;
}
namedWindow("input-image", WINDOW_AUTOSIZE);
namedWindow(output_win, WINDOW_AUTOSIZE);
imshow("input-image", src);
cvtColor(src, src, COLOR_BGR2GRAY);
const char* trackbar_title = "Threshold Value:";
createTrackbar(trackbar_title, output_win, &threshold_value, threshold_max, Demo_Contours);
Demo_Contours(0, 0);
waitKey(0);
return 0;
}
void Demo_Contours(int, void*) {
Mat canny_output;
vector<vector<Point>> contours;
vector<Vec4i> hierachy;
Canny(src, canny_output, threshold_value, threshold_value * 2, 3, false);
findContours(canny_output, contours, hierachy, RETR_TREE, CHAIN_APPROX_SIMPLE, Point(0, 0));
dst = Mat::zeros(src.size(), CV_8UC3);
RNG rng(12345);
for (size_t i = 0; i < contours.size(); i++) {
Scalar color = Scalar(rng.uniform(0, 255), rng.uniform(0, 255), rng.uniform(0, 255));
drawContours(dst, contours, i, color, 2, 8, hierachy, 0, Point(0, 0));
}
imshow(output_win, dst);
}
什么是凸包(Convex Hull),在一个多变形边缘或者内部任 意两个点的连线都包含在多边形边界或者内部。
正式定义:
包含点集合S中所有点的最小凸多边形称为凸包
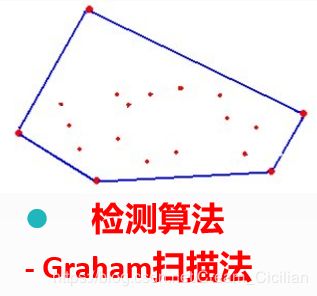
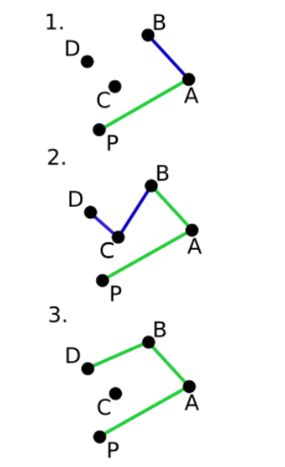
首先选择Y方向最低的点作为起始点p0
从p0开始极坐标扫描,依次添加p1….pn(排序顺序是根据极坐标的角度大小,逆时针方向)
对每个点pi来说,如果添加pi点到凸包中导致一个左转向(逆时针方法)则添加该点到凸包, 反之如果导致一个右转向(顺时针方向)删除该点从凸包中
convexHull(
InputArray points,// 输入候选点,来自findContours
OutputArray hull,// 凸包
bool clockwise,// default true, 顺时针方向
bool returnPoints)// true 表示返回点个数,如果第二个参数是 vector则自动忽略
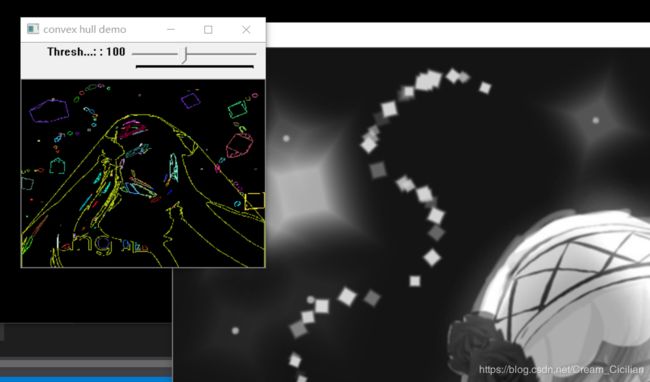
首先把图像从RGB转为灰度
然后再转为二值图像
在通过发现轮廓得到候选点
凸包API调用
绘制显示。
#include
#include
#include
using namespace std;
using namespace cv;
Mat src, src_gray, dst;
int threshold_value = 100;
int threshold_max = 255;
const char* output_win = "convex hull demo";
void Threshold_Callback(int, void*);
RNG rng(12345);
int main(int argc, char** argv) {
src = imread("C:/Users/Admin/Desktop/1.jpg");
if (!src.data) {
printf("could not load image...\n");
return -1;
}
const char* input_win = "input image";
namedWindow(input_win, WINDOW_AUTOSIZE);
namedWindow(output_win, WINDOW_NORMAL);
const char* trackbar_label = "Threshold : ";
cvtColor(src, src_gray, COLOR_BGR2GRAY);
blur(src_gray, src_gray, Size(3, 3), Point(-1, -1), BORDER_DEFAULT);
imshow(input_win, src_gray);
createTrackbar(trackbar_label, output_win, &threshold_value, threshold_max, Threshold_Callback);
Threshold_Callback(0, 0);
waitKey(0);
return 0;
}
void Threshold_Callback(int, void*) {
Mat bin_output;
vector<vector<Point>> contours;
vector<Vec4i> hierachy;
threshold(src_gray, bin_output, threshold_value, threshold_max, THRESH_BINARY);
findContours(bin_output, contours, hierachy, RETR_TREE, CHAIN_APPROX_SIMPLE, Point(0, 0));
vector<vector<Point>> convexs(contours.size());
for (size_t i = 0; i < contours.size(); i++) {
convexHull(contours[i], convexs[i], false, true);
}
// 绘制
dst = Mat::zeros(src.size(), CV_8UC3);
vector<Vec4i> empty(0);
for (size_t k = 0; k < contours.size(); k++) {
Scalar color = Scalar(rng.uniform(0, 255), rng.uniform(0, 255), rng.uniform(0, 255));
drawContours(dst, contours, k, color, 2, LINE_8, hierachy, 0, Point(0, 0));
drawContours(dst, convexs, k, color, 2, LINE_8, empty, 0, Point(0, 0));
}
imshow(output_win, dst);
return;
}
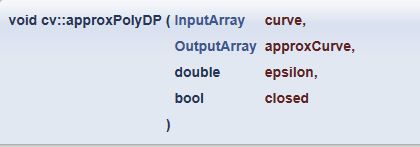
approxPolyDP(InputArray curve, OutputArray approxCurve, double epsilon, bool closed)
基于RDP算法实现,目的是减少多边形轮廓点数
cv::boundingRect(InputArray points)得到轮廓周围最小矩形左上交点坐标和右下角点坐标,绘制一个矩形
cv::minAreaRect(InputArray points)得到一个旋转的矩形,返回旋转矩形
cv::minEnclosingCircle(InputArray points, //得到最小区域圆形
Point2f& center, // 圆心位置
float& radius)// 圆的半径
cv::fitEllipse(InputArray points)得到最小椭圆
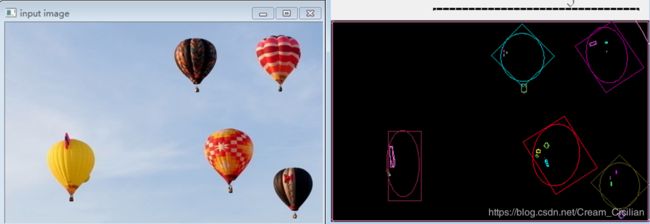
首先将图像变为二值图像
发现轮廓,找到图像轮廓
通过相关API在轮廓点上找到最小包含矩形和圆,旋转矩形与椭圆。
绘制它们。
#include
#include
#include
using namespace std;
using namespace cv;
Mat src, gray_src, drawImg;
int threshold_v = 170;
int threshold_max = 255;
const char* output_win = "rectangle-demo";
RNG rng(12345);
void Contours_Callback(int, void*);
int main(int argc, char** argv) {
src = imread("C:/Users/Admin/Desktop/1.jpg");
if (!src.data) {
printf("could not load image...\n");
return -1;
}
cvtColor(src, gray_src, COLOR_BGR2GRAY);
blur(gray_src, gray_src, Size(3, 3), Point(-1, -1));
const char* source_win = "input image";
namedWindow(source_win, WINDOW_AUTOSIZE);
namedWindow(output_win, WINDOW_AUTOSIZE);
imshow(source_win, src);
createTrackbar("Threshold Value:", output_win, &threshold_v, threshold_max, Contours_Callback);
Contours_Callback(0, 0);
waitKey(0);
return 0;
}
void Contours_Callback(int, void*) {
Mat binary_output;
vector<vector<Point>> contours;
vector<Vec4i> hierachy;
threshold(gray_src, binary_output, threshold_v, threshold_max, THRESH_BINARY);
//imshow("binary image", binary_output);
findContours(binary_output, contours, hierachy, RETR_TREE, CHAIN_APPROX_SIMPLE, Point(-1, -1));
vector<vector<Point>> contours_ploy(contours.size());
vector<Rect> ploy_rects(contours.size());
vector<Point2f> ccs(contours.size());
vector<float> radius(contours.size());
vector<RotatedRect> minRects(contours.size());
vector<RotatedRect> myellipse(contours.size());
for (size_t i = 0; i < contours.size(); i++) {
approxPolyDP(Mat(contours[i]), contours_ploy[i], 3, true);
ploy_rects[i] = boundingRect(contours_ploy[i]);
minEnclosingCircle(contours_ploy[i], ccs[i], radius[i]);
if (contours_ploy[i].size() > 5) {
myellipse[i] = fitEllipse(contours_ploy[i]);
minRects[i] = minAreaRect(contours_ploy[i]);
}
}
// draw it
drawImg = Mat::zeros(src.size(), src.type());
Point2f pts[4];
for (size_t t = 0; t < contours.size(); t++) {
Scalar color = Scalar(rng.uniform(0, 255), rng.uniform(0, 255), rng.uniform(0, 255));
//rectangle(drawImg, ploy_rects[t], color, 2, 8);
//circle(drawImg, ccs[t], radius[t], color, 2, 8);
if (contours_ploy[t].size() > 5) {
ellipse(drawImg, myellipse[t], color, 1, 8);
minRects[t].points(pts);
for (int r = 0; r < 4; r++) {
line(drawImg, pts[r], pts[(r + 1) % 4], color, 1, 8);
}
}
}
imshow(output_win, drawImg);
return;
}
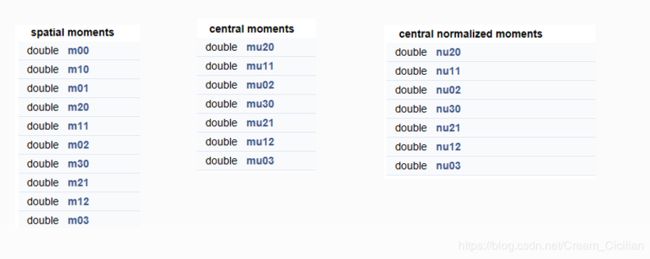
moments(
InputArray array,//输入数据
bool binaryImage=false // 是否为二值图像
)
contourArea(
InputArray contour,//输入轮廓数据
bool oriented// 默认false、返回绝对值)
arcLength(
InputArray curve,//输入曲线数据
bool closed// 是否是封闭曲线)
提取图像边缘
发现轮廓
计算每个轮廓对象的矩
计算每个对象的中心、弧长、面积
#include
#include
#include
using namespace std;
using namespace cv;
Mat src, gray_src;
int threshold_value = 80;
int threshold_max = 255;
const char* output_win = "image moents demo";
RNG rng(12345);
void Demo_Moments(int, void*);
int main(int argc, char** argv) {
src = imread("C:/Users/Admin/Desktop/1.jpg");
if (!src.data) {
printf("could not load image...\n");
return -1;
}
cvtColor(src, gray_src, COLOR_BGR2GRAY);
GaussianBlur(gray_src, gray_src, Size(3, 3), 0, 0);
char input_win[] = "input image";
namedWindow(input_win, WINDOW_AUTOSIZE);
namedWindow(output_win, WINDOW_AUTOSIZE);
imshow(input_win, src);
createTrackbar("Threshold Value : ", output_win, &threshold_value, threshold_max, Demo_Moments);
Demo_Moments(0, 0);
waitKey(0);
return 0;
}
void Demo_Moments(int, void*) {
Mat canny_output;
vector<vector<Point>> contours;
vector<Vec4i> hierachy;
Canny(gray_src, canny_output, threshold_value, threshold_value * 2, 3, false);
findContours(canny_output, contours, hierachy, RETR_TREE, CHAIN_APPROX_SIMPLE, Point(0, 0));
vector<Moments> contours_moments(contours.size());
vector<Point2f> ccs(contours.size());
for (size_t i = 0; i < contours.size(); i++) {
contours_moments[i] = moments(contours[i]);
ccs[i] = Point(static_cast<float>(contours_moments[i].m10 / contours_moments[i].m00), static_cast<float>(contours_moments[i].m01 / contours_moments[i].m00));
}
Mat drawImg;// = Mat::zeros(src.size(), CV_8UC3);
src.copyTo(drawImg);
for (size_t i = 0; i < contours.size(); i++) {
if (contours[i].size() < 100) {
continue;
}
Scalar color = Scalar(rng.uniform(0, 255), rng.uniform(0, 255), rng.uniform(0, 255));
printf("center point x : %.2f y : %.2f\n", ccs[i].x, ccs[i].y);
printf("contours %d area : %.2f arc length : %.2f\n", i, contourArea(contours[i]), arcLength(contours[i], true));
drawContours(drawImg, contours, i, color, 2, 8, hierachy, 0, Point(0, 0));
circle(drawImg, ccs[i], 2, color, 2, 8);
}
imshow(output_win, drawImg);
return;
}
pointPolygonTest(
InputArray contour,// 输入的轮廓
Point2f pt, // 测试点
bool measureDist // 是否返回距离值,如果是false,1表示在内面,0表示在边界上,-1表示在外部,true返回实际距离
)
返回数据是double类型
构建一张400x400大小的图片, Mat::Zero(400, 400, CV_8UC1)
画上一个六边形的闭合区域line
发现轮廓
对图像中所有像素点做点 多边形测试,得到距离,归一化后显示。
#include
#include
#include
using namespace std;
using namespace cv;
int main(int argc, char** argv) {
const int r = 100;
Mat src = Mat::zeros(r * 4, r * 4, CV_8UC1);
vector<Point2f> vert(6);
vert[0] = Point(3 * r / 2, static_cast<int>(1.34*r));
vert[1] = Point(1 * r, 2 * r);
vert[2] = Point(3 * r / 2, static_cast<int>(2.866*r));
vert[3] = Point(5 * r / 2, static_cast<int>(2.866*r));
vert[4] = Point(3 * r, 2 * r);
vert[5] = Point(5 * r / 2, static_cast<int>(1.34*r));
for (int i = 0; i < 6; i++) {
line(src, vert[i], vert[(i + 1) % 6], Scalar(255), 3, 8, 0);
}
vector<vector<Point>> contours;
vector<Vec4i> hierachy;
Mat csrc;
src.copyTo(csrc);
findContours(csrc, contours, hierachy, RETR_TREE, CHAIN_APPROX_SIMPLE, Point(0, 0));
Mat raw_dist = Mat::zeros(csrc.size(), CV_32FC1);
for (int row = 0; row < raw_dist.rows; row++) {
for (int col = 0; col < raw_dist.cols; col++) {
double dist = pointPolygonTest(contours[0], Point2f(static_cast<float>(col), static_cast<float>(row)), true);
raw_dist.at<float>(row, col) = static_cast<float>(dist);
}
}
double minValue, maxValue;
minMaxLoc(raw_dist, &minValue, &maxValue, 0, 0, Mat());
Mat drawImg = Mat::zeros(src.size(), CV_8UC3);
for (int row = 0; row < drawImg.rows; row++) {
for (int col = 0; col < drawImg.cols; col++) {
float dist = raw_dist.at<float>(row, col);
if (dist > 0) {
drawImg.at<Vec3b>(row, col)[0] = (uchar)(abs(1.0 - (dist / maxValue)) * 255);
}
else if (dist < 0) {
drawImg.at<Vec3b>(row, col)[2] = (uchar)(abs(1.0 - (dist / minValue)) * 255);
}
else {
drawImg.at<Vec3b>(row, col)[0] = (uchar)(abs(255 - dist));
drawImg.at<Vec3b>(row, col)[1] = (uchar)(abs(255 - dist));
drawImg.at<Vec3b>(row, col)[2] = (uchar)(abs(255 - dist));
}
}
}
const char* output_win = "point polygon test demo";
char input_win[] = "input image";
namedWindow(input_win, WINDOW_AUTOSIZE);
namedWindow(output_win, WINDOW_AUTOSIZE);
imshow(input_win, src);
imshow(output_win, drawImg);
waitKey(0);
return 0;
}