SIDE-SCAN SONAR IMAGE PROCESSING
电子科技大学 格拉斯哥学院2017级 王子林 报告正文Side-scan Sonar Image Processing
- Keywords
- Abstract
- Basic Processing
- The Raw Data
- Image Presentation
- 3-Dimensional Measurement
- Problems
- Simple Image Strengthening method
- i.adjusting gray level and contrast ratio
- Linear Strengthening Method
- Statistical Algorithm
- Reference
电子科技大学 学号2017200602007 王子林
Keywords
side-scan sonar, image processing
Abstract
Side scan sonar plays an essential role in marine archaeology. In order to get the image below water on the seabed, ships, submarines, vessels, etc. has being equipped with sonar devices. These devices emit conical or fan-shaped pulses across a wide range of angle perpendicular to the surface of seabed and receive the reflected beam in the form of series of cross-track slices. Moving together with the carrier, the slices are able to generate an image of the seabed below. Also because side-scan sonar is versatile and inexpensive, it is widely used in the research of marine geography.
paraphrase from:Wikipedia
Basic Processing
The side-scan sonar device receives the reflected back-scattered signals after emitting the pulses, which is the raw data needed to be processed by computers.
The Raw Data

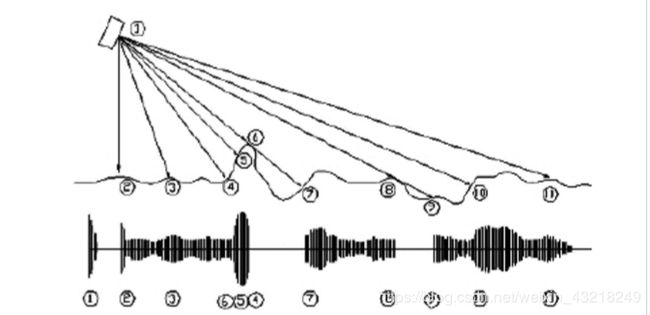
figure 1
From figure 1, we can see the geography feature of the seabed as well as the back-scattered pulse intensity corresponded with each point numbered. Number 1 point is the signal emitter. After the pulses has been emitted, they are going to be reflected back from the bottom of the sea. Usually, the intensity is large when the corresponding area of the seabed is smooth, raised and rough, and vice versa. Note that points 4, 5 and 6, they are from one “hill”, because 6 is the closest point, the receiver will get signal 6 first and 4 last. Also between, 6 and 7, the signal cannot be found because the “hill” keeps the signals from the the area, which is called “Shadow Area”. This is also true for the area from 8 to 9.
The intensity of each signal to each geographic point is the raw data the computer receive. After that, the raw data is going to be processed by the computer.

Image Presentation
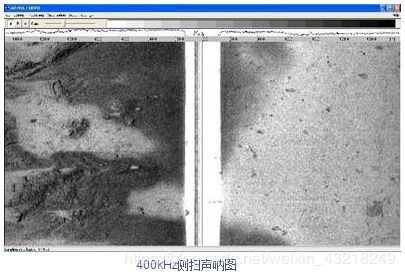
The side-scan sonar data are presented in the form of gray level images. There are two basic features of geography on seabed: the ridgy and the concave area. The former one has a gray leveled character: black represents the physical objects (the raised area) and white is on behalf of shadow of the ridgy region. Often on a scan line, black is always before white color in ridgy area. On the other hand, the concave region is on the contrary(white before black on a scan line).
3-Dimensional Measurement

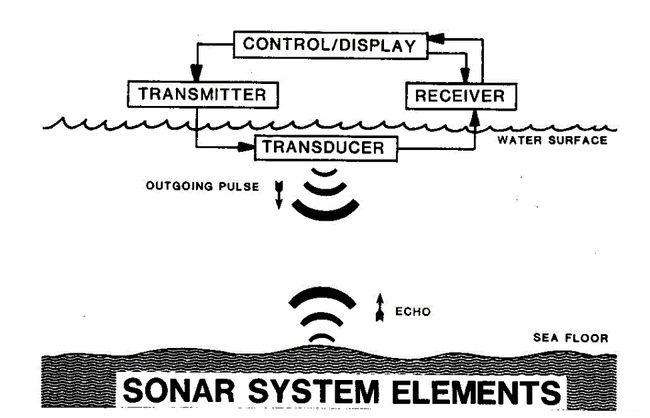
figure 2
If only one emitter is installed , we can only detect geography of sea floor on one line. Therefore, we need to equip the ship (submarine) with at least two, in order to form a 3-dimensional image. A 3D picture can better detect and calculate the depth by the phase difference between the signals.
Problems
The side-scan sonar image is basically generated by the received reflected sonar wave intensity, which is a index of the geography feature by the method of gray level. Although it is simple to understand, there are still some problems with the poor resolution ratio, brightness variation and patching gaps. We still need to work on the problems to make the ocean detection easier.
Simple Image Strengthening method
i.adjusting gray level and contrast ratio
there are 2 ways
Linear Strengthening Method
y=k(x-a)+b
in the formula x is the specified point’s gray level, y is the expected one, what we need to do is to adjust constant k to change the contrast ratio.
Statistical Algorithm
Y(x,y)=(S/s)[u(x,y)-e]+E
in the formula Y is the expected gray level, S and E are the expected standard deviation and the expectation, while s and e are the actual gray level.
In general, this method is more complicated but generalized.
Reference
1.Feng Xu(许枫) and Jiangjiang Wei(魏建江) 北京科学院声学研究所 北京100080 声纳技术及其应用专题 第七讲 侧扫声纳
2.Yet-Chung Chang, Shu-Kun Hsu, and Ching-Hui Tsai Journal of Marine Science and Technology, Vol. 18, No. 6, pp. 785-789(2010) **Side-scan Sonar Image Processing Correcting Brightness Variation and Patching Gaps
3.李胜全,滕惠忠,凌勇,刘雁春,严晓明 海军海洋测绘研究所,天津 300061 侧扫声纳的图像增强处理