交通流量图(transport Sankey Diagram)的绘制:距离矩阵(distance matrix)转换为OD数据结构并作图
点赞发Nature
关注中Science
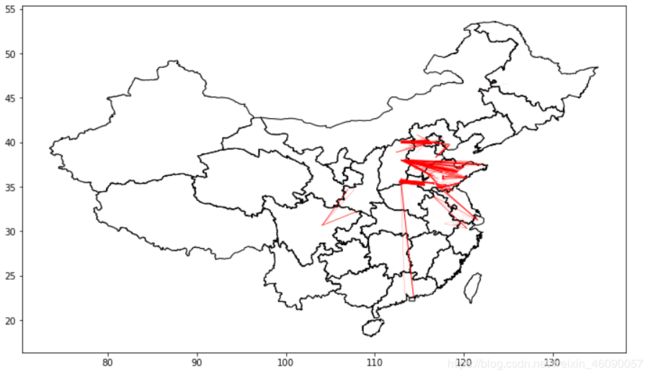
最近在做全国煤-电网络的环境排放,想要绘制一个全国煤炭运输的original-destination图。就是画成百度迁徙的那种形式。
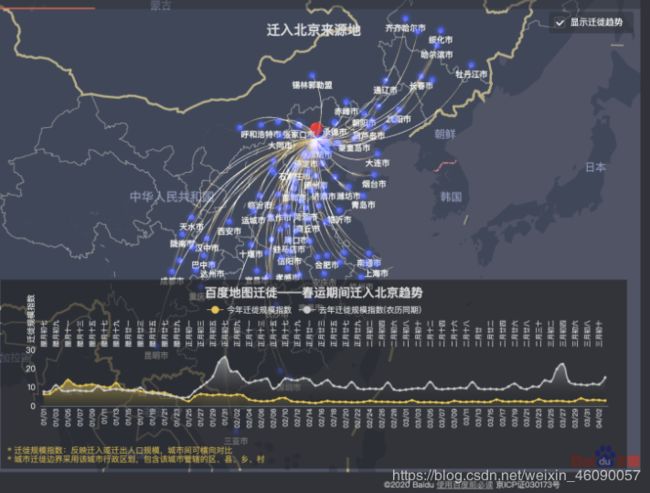
代码如下:
import geopandas as gpd
import numpy as np
import os
import pandas as pd
import matplotlib.pyplot as plt

path = r"E:\tencent files\chrome Download\Research\LCA\LCA Coal_fired power plant phaseout\data"
trans_2014 = r"coal_transport2014"
transport_matrix = r"coal_trasport2014.xlsx"
mines = "node_mine_pair.xlsx"
power_plants = "node_power_pair.xlsx"
file = r"Results.xlsx"

trans_mat = pd.read_excel(
    os.path.join(path, trans_2014, transport_matrix), index_col=0
).stack()

mine = (
    pd.read_excel(os.path.join(path, trans_2014, mines))
    .rename(mapper={"node_id": "node_id_mine"}, axis=1)
    .groupby("node_id_mine")
    .mean()
    .reset_index()
)
power_plant = (
    pd.read_excel(os.path.join(path, trans_2014, power_plants))
    .rename(mapper={"node_id": "node_id_pp"}, axis=1)
    .groupby("node_id_pp")
    .mean()
    .reset_index()
)

trans_mat_filt = (
    pd.DataFrame(trans_mat[trans_mat != 0], columns=["coal_trans"])
    .reset_index()
    .rename(mapper={"level_0": "node_id_mine", "level_1": "node_id_pp"}, axis=1)
)


OD_df = pd.merge(
    pd.merge(
        trans_mat_filt,
        mine[["node_id_mine", "LongDD", "LatDD"]],
        on="node_id_mine",
        how="left",
    ),
    power_plant[["node_id_pp", "longitude", "latitude"]],
    on="node_id_pp",
    how="left",
).rename(
    mapper={
        "LongDD": "origin_y",
        "LatDD": "origin_x",
        "longitude": "destination_y",
        "latitude": "destination_x",
    },
    axis=1,
)

CHN_adm = gpd.read_file(r"\中国行政区.shp")
CHN_adm.to_crs(epsg=4326).head(3)

def plot_od(od):
    fig, ax = plt.subplots(figsize=(12, 12))
    CHN_adm.plot(ax=ax, facecolor="none", edgecolor="black", linewidth=0.2)
    CHN_adm.plot(ax=ax, facecolor="none", edgecolor="black", linewidth=1)
    for i in od.index:
        ax.plot(
            [od.loc[i, "origin_y"], od.loc[i, "destination_y"]],
            [od.loc[i, "origin_x"], od.loc[i, "destination_x"]],
            linewidth=od.loc[i, "coal_trans"] * 0.0000008,
            color="red",
        )

plot_od(OD_df)
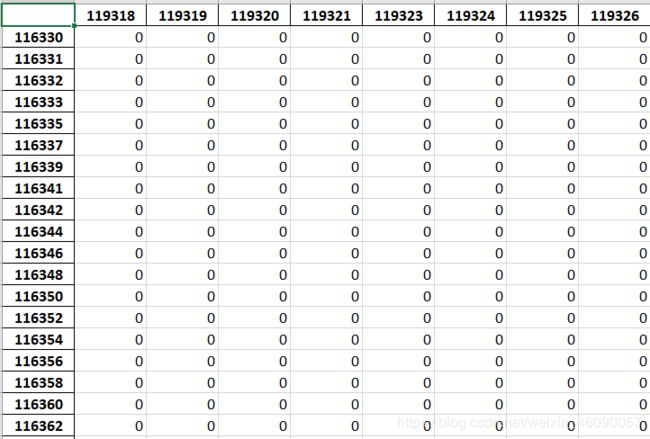
我现在有的是一张从用Dijkstra算法加线性规划得到的距离矩阵图,大概是这样:
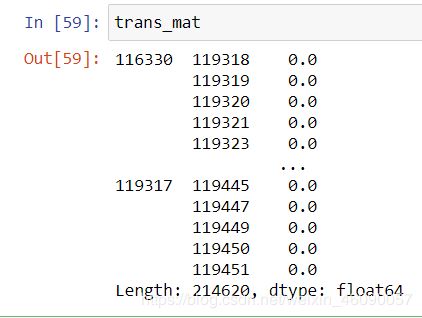
第一步是将距离矩阵转换为OD图的数据格式,用df.stack()函数,得到一个这样的DataSeries:
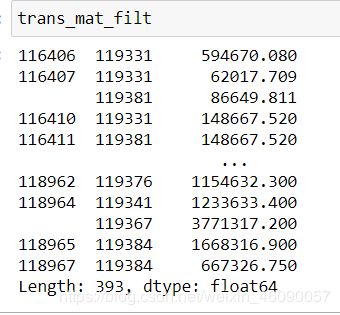
清洗掉零值:
加入出发位置和到达位置的地理坐标信息:
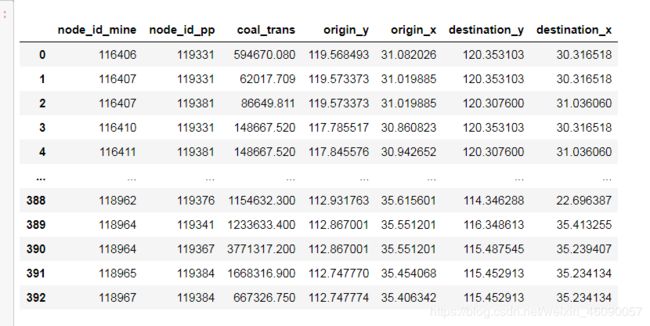
效果图有点丑。。。。。。感觉用geopandas和与gis相关的package做出来会好看点吧。。。。
核心是用stack方法把二维矩阵转换为一维DataFrame