MATLAB GUI图形界面实现串口通讯实时绘图(一)
MATLAB GUI图形界面实现串口通讯实时绘图(一)
- 前言
- 串口通讯
- 实时绘图
- GUI图形界面
- 遇到的问题
- 完整代码
前言
之前做了一些概念性的理解,现在把实现GUI界面串口实时绘图的主要注意方面记录一下,以防以后忘记。
主要参考了文库的一篇文库的MATLAB串口操作教程,翻译的应该是官方的教程。基础的东西不再提了,说一下需要注意的地方
串口通讯
- 最好在使用
s=serial(‘COM1’);命令打开串口之前,写上delete(instrfindall);就是关闭其他没有在用的端口。 s.ReadAsyncMode='continuous';或者s.ReadAsyncMode='manual';其中’continuous’模式是发完一段一起读进来,'manual’是有啥就读。- 在发过来的字符串中,刚刚打开时字符串不完整,使用
if length(out)<73
   continue
else
   ......
语句来判断发送过来的字符串完整度,其中continue的作用是直接返回下一个循环不再向下执行语句。
- 使用完后要将打开的端口关闭,这是个好习惯
实时绘图
-
实时绘图的方法有这几个,还了解过animateline结合addpoints和drawnow的方法,但是貌似只能适用一条曲线,我要画出6条,所以不适用(有大神能实现可以讨论一下啊)。最后选择了hold on模式下的 动态多条曲线(即时数据) 的方法,其中
plot(x,y,'EraseMode','background','MarkerSize',5);的’EraseMode‘,'background’被提示不用了(Matlab版本2017b),将其删除后效果不变,不影响运行。 -
若要实现x轴的实时变化就需要对坐标轴进行实时改动
......

  x_qujian=0;

  axis([x_qujian x_qujian+10 20000 50000])

  ......
  for i=1:1000
 ......
      drawnow
         x_qujian=x_qujian+0.1;
         axis([x_qujian x_qujian+10 min(min(b1)) max(max(b1))])
 .....
 end
其中…为其他中间过程,省略。b1为矩阵,写成上面代码中的样子是为了实时调整纵坐标范围,使曲线一直显示在坐标中。
- 根据上述的教程中的方法,编写多条动态曲线时,需要事先写上在
plot中…相当于是定义出来吧,例如real_plot=plot(x_p,y_p1,x_p,y_p2,x_p,y_p3,x_p,y_p4,x_p,y_p5,x_p,y_p6,'MarkerSize',5);我想以x_p为横坐标y_p?为纵坐标画6条曲线,就需要事先这样写。纵坐标的数据必须放到不同的变量中,如果放到同一个矩阵中利用取行列的方式表示,就不能画出曲线,原因未知。设置多条动态曲线的格式如下
        hold on
        x_p=[x_p 5+0.1*(j+1)];
        y_p1=[y_p1 b1(j,1)];y_p2=[y_p2 b1(j,2)];y_p3=[y_p3 b1(j,3)];y_p4=[y_p4 b1(j,4)];y_p5=[y_p5 b1(j,5)];y_p6=[y_p6 b1(j,6)];
        set(real_plot(1),'XData',x_p,'YData',y_p1)
        set(real_plot(2),'XData',x_p,'YData',y_p2)
        set(real_plot(3),'XData',x_p,'YData',y_p3)
        set(real_plot(4),'XData',x_p,'YData',y_p4)
        set(real_plot(5),'XData',x_p,'YData',y_p5)
        set(real_plot(6),'XData',x_p,'YData',y_p6)
        drawnow
x_p是每条曲线的起始点,通过不断给x_p赋值来时曲线更新,赋值方式与横坐标轴的赋值方式最好一致。
- 有一个清空缓冲区的命令
fread(s,s.BytesAvailable);原理未知。
GUI图形界面
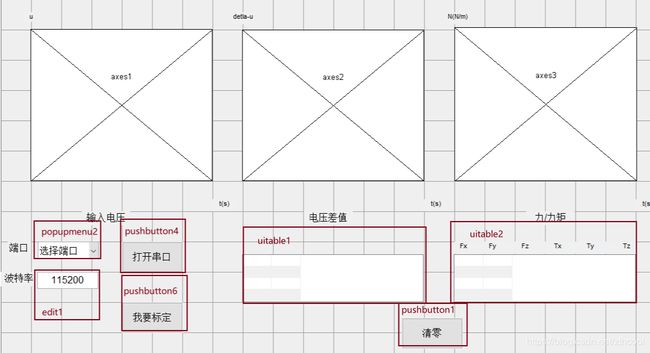
先看一下GUI图形界面的整体布局以及实现功能(数据转化肯定不准确,后期需要优化,先看功能实现)
- 端口号是利用
seriallist函数获得活跃端口,存储到矩阵中,在显示在下拉菜单中,目前手头只有一个串口,无法测试功能完整性(目测会在矩阵cell与string之间转换出现问题) handles.***是将属性名为***的值在不同的控件中传递,但好像只有原始的handles.***的值发生改变后才会使这个变量变化,若在其他控件中改变其值,返回后仍为原值(应该是所谓的局部变量吧)。在每次给handles.***赋值后,要用guidata(hObject, handles);将结构更新- 如果需要在很多控件中使用并改变变量值,需要使用全局变量
global *** - 按钮的字符串互相转换,是利用
strcmp对比字符串函数实现 - 在不同的坐标轴中画图,要利用
plot(handles.axes1,x,y)。改变横纵坐标利用handles.axes3.XLim和handles.axes3.YLim。改变其他参量,双击参看属性值。
遇到的问题
- 目前对中断回调还不是很明白,不太会用,回调函数是自己创建的么?我想实现一个打开串口错误就退出重新加载窗口的回调函数,怎么实现?
完整代码
- 其中
pushbutton4为GUI中的打开串口按钮,pushbutton1为清零按钮,
function varargout = chuankou02(varargin)

gui_Singleton = 1;
gui_State = struct('gui_Name',       mfilename, ...
                   'gui_Singleton',  gui_Singleton, ...
                   'gui_OpeningFcn', @chuankou02_OpeningFcn, ...
                   'gui_OutputFcn',  @chuankou02_OutputFcn, ...
                   'gui_LayoutFcn',  [] , ...
                   'gui_Callback',   []);
if nargin && ischar(varargin{1})
    gui_State.gui_Callback = str2func(varargin{1});
end

if nargout
    [varargout{1:nargout}] = gui_mainfcn(gui_State, varargin{:});
else
    gui_mainfcn(gui_State, varargin{:});
end
% End initialization code - DO NOT EDIT


% --- Executes just before chuankou02 is made visible.
function chuankou02_OpeningFcn(hObject, eventdata, handles, varargin)
% This function has no output args, see OutputFcn.
% hObject    handle to figure
% eventdata  reserved - to be defined in a future version of MATLAB
% handles    structure with handles and user data (see GUIDATA)
% varargin   command line arguments to chuankou02 (see VARARGIN)

% Choose default command line output for chuankou02
handles.output = hObject;
%初始化参数
saomiao=seriallist;
set(handles.popupmenu2,'string',saomiao)
handles.x_qujian=0;
global j_0
j_0=1;
guidata(hObject, handles);
% UIWAIT makes chuankou02 wait for user response (see UIRESUME)
% uiwait(handles.figure1);

function pushbutton1_Callback(hObject, eventdata, handles)
% hObject    handle to pushbutton1 (see GCBO)
% eventdata  reserved - to be defined in a future version of MATLAB
% handles    structure with handles and user data (see GUIDATA)
global j_0
j_0=handles.j;
guidata(hObject, handles);
% --- Executes on button press in pushbutton2.

function pushbutton4_Callback(hObject, eventdata, handles)
% hObject    handle to pushbutton4 (see GCBO)
% eventdata  reserved - to be defined in a future version of MATLAB
% handles    structure with handles and user data (see GUIDATA)
global s j_0 biaoji
if strcmp(get(handles.pushbutton4,'string'),'打开串口')
    try
        delete(instrfindall) %关闭没用的,这句很重要
        duankou_zhi=get(handles.popupmenu2,'value');
        duankou_zong=get(handles.popupmenu2,'string');
        handles.duankou=duankou_zong(duankou_zhi,:);
        handles.botelv=str2double(get(handles.edit1,'string'));
        s=serial(handles.duankou);%创建串口
        set(s,'BaudRate',handles.botelv); %设置波特率
        set(s,'inputBufferSize',1024000) %设置输入缓冲区域为1M
        s.ReadAsyncMode='continuous';
        fopen(s);
        biaoji=1;
        set(handles.pushbutton4,'string','关闭串口');
        msgbox(['打开',handles.duankou,'成功']);
    catch err
        msgbox('打开失败');
    end
        x_qujian=handles.x_qujian;
        hold off

        x_p=5;
        y_p1=0;y_p2=0;y_p3=0;y_p4=0;y_p5=0;y_p6=0;
        real_u_plot=plot(handles.axes1,x_p,y_p1,x_p,y_p2,x_p,y_p3,x_p,y_p4,x_p,y_p5,x_p,y_p6,'MarkerSize',5);
        handles.axes1.XLim=[x_qujian x_qujian+10];handles.axes1.YLim=[20000 50000];
        handles.axes1.XGrid='on';handles.axes1.YGrid='on';

        x_p_chazhi=5;
        y_p_chazhi1=0;y_p_chazhi2=0;y_p_chazhi3=0;y_p_chazhi4=0;y_p_chazhi5=0;y_p_chazhi6=0;
        chazhi_u_plot=plot(handles.axes2,x_p_chazhi,y_p_chazhi1,x_p_chazhi,y_p_chazhi2,x_p_chazhi,y_p_chazhi3,x_p_chazhi,y_p_chazhi4,x_p_chazhi,y_p_chazhi5,x_p_chazhi,y_p_chazhi6,'MarkerSize',5);
        handles.axes2.XLim=[x_qujian x_qujian+10];handles.axes2.YLim=[-5 5];
        handles.axes2.XGrid='on';handles.axes2.YGrid='on';

        x_p2=5;
        y_p_ft1=0;y_p_ft2=0;y_p_ft3=0;y_p_ft4=0;y_p_ft5=0;y_p_ft6=0;
        ft_u_plot=plot(handles.axes3,x_p,y_p_ft1,x_p,y_p_ft2,x_p,y_p_ft3,x_p,y_p_ft4,x_p,y_p_ft5,x_p,y_p_ft6);
        handles.axes3.XLim=[x_qujian x_qujian+10];handles.axes3.YLim=[-5 5];
        handles.axes3.XGrid='on';handles.axes3.YGrid='on';

        net0=load('C_cal_net01');
        net=net0.net;

        %赋值给表格窗口,实时显示============================================
        u_chazhi_juzhen=zeros(4,6);
        Ft_2_juzhen=zeros(4,6);
        j=1;
        for i=1:500
%             zhuangtai=s.status
            if biaoji==2
                biaoji=1;
                break
            end
            out=fscanf(s);
            if length(out)<72
             continue
            else
                data_16{j,:}=out;
                fenlie_16(j,:)=regexp(data_16{j,:},'\t','split');
                a1=fenlie_16{j,1};a2=fenlie_16{j,2};a3=fenlie_16{j,3};a4=fenlie_16{j,4};a5=fenlie_16{j,5};a6=fenlie_16{j,6};
                a1(find(isspace(a1)))=[];a2(find(isspace(a2)))=[];a3(find(isspace(a3)))=[];a4(find(isspace(a4)))=[];a5(find(isspace(a5)))=[];a6(find(isspace(a6)))=[];
                b1(j,1)=hex2dec(a1(6:9));b1(j,2)=hex2dec(a2(6:9));b1(j,3)=hex2dec(a3(6:9));b1(j,4)=hex2dec(a4(6:9));b1(j,5)=hex2dec(a5(6:9));b1(j,6)=hex2dec(a6(6:9));
                %输入电压动态曲线=========================
                hold on
                x_p=[x_p 5+0.1*(j+1)];
                y_p1=[y_p1 b1(j,1)];y_p2=[y_p2 b1(j,2)];y_p3=[y_p3 b1(j,3)];y_p4=[y_p4 b1(j,4)];y_p5=[y_p5 b1(j,5)];y_p6=[y_p6 b1(j,6)];
                set(real_u_plot(1),'XData',x_p,'YData',y_p1)
                set(real_u_plot(2),'XData',x_p,'YData',y_p2)
                set(real_u_plot(3),'XData',x_p,'YData',y_p3)
                set(real_u_plot(4),'XData',x_p,'YData',y_p4)
                set(real_u_plot(5),'XData',x_p,'YData',y_p5)
                set(real_u_plot(6),'XData',x_p,'YData',y_p6)
                drawnow
                x_qujian=x_qujian+0.1;
                handles.axes1.XLim=[x_qujian x_qujian+10];
                handles.axes1.YLim=[min(min(b1))-1000 max(max(b1))+1000];
                %电压差值动态曲线=================================
                hold on
                handles.j=j;
                u_0=b1(j_0,:);
                u_real=b1(j,:);
                u_chazhi=u_real-u_0;
                x_p_chazhi=[x_p_chazhi 5+0.1*(j+1)];
                y_p_chazhi1=[y_p_chazhi1 u_chazhi(:,1)];y_p_chazhi2=[y_p_chazhi2 u_chazhi(:,2)];y_p_chazhi3=[y_p_chazhi3 u_chazhi(:,3)];y_p_chazhi4=[y_p_chazhi4 u_chazhi(:,4)];y_p_chazhi5=[y_p_chazhi5 u_chazhi(:,5)];y_p_chazhi6=[y_p_chazhi6 u_chazhi(:,6)];
                set(chazhi_u_plot(1),'XData',x_p_chazhi,'YData',y_p_chazhi1)
                set(chazhi_u_plot(2),'XData',x_p_chazhi,'YData',y_p_chazhi2)
                set(chazhi_u_plot(3),'XData',x_p_chazhi,'YData',y_p_chazhi3)
                set(chazhi_u_plot(4),'XData',x_p_chazhi,'YData',y_p_chazhi4)
                set(chazhi_u_plot(5),'XData',x_p_chazhi,'YData',y_p_chazhi5)
                set(chazhi_u_plot(6),'XData',x_p_chazhi,'YData',y_p_chazhi6)
                handles.axes2.XLim=[x_qujian x_qujian+10];
                handles.axes2.YLim=[-100 100];
                drawnow
                %力/力矩动态曲线================================================
                u_min=-310;u_max=781;
                u_guiyi=((2*(u_chazhi-u_min))/(u_max-u_min))-1;
                FT_guiyi=sim(net,u_guiyi.').';
                f_min=-20.5740;f_max=21.7350;
                FT=(((FT_guiyi+1)*(f_max-f_min))/2)+f_min;
                hold on
                x_p2=[x_p2 5+0.1*(j+1)];
                y_p_ft1=[y_p_ft1 FT(:,1)];y_p_ft2=[y_p_ft2 FT(:,2)];y_p_ft3=[y_p_ft3 FT(:,3)];y_p_ft4=[y_p_ft4 FT(:,4)];y_p_ft5=[y_p_ft5 FT(:,5)];y_p_ft6=[y_p_ft6 FT(:,6)];
                set(ft_u_plot(1),'XData',x_p2,'YData',y_p_ft1)
                set(ft_u_plot(2),'XData',x_p2,'YData',y_p_ft2)
                set(ft_u_plot(3),'XData',x_p2,'YData',y_p_ft3)
                set(ft_u_plot(4),'XData',x_p2,'YData',y_p_ft4)
                set(ft_u_plot(5),'XData',x_p2,'YData',y_p_ft5)
                set(ft_u_plot(6),'XData',x_p2,'YData',y_p_ft6)
                handles.axes3.XLim=[x_qujian x_qujian+10];
                handles.axes3.YLim=[-100 100];
                drawnow
        %赋值给文本窗口,实时显示============================================
                Ft_2=roundn(FT,-2);
                u_chazhi_juzhen(j,:)=u_chazhi;
                Ft_2_juzhen(j,:)=Ft_2;
                if j<4
                    u_chazhi_biaoge=u_chazhi_juzhen;
                    Ft_2_biaoge=Ft_2_juzhen;
                else
                    u_chazhi_biaoge=u_chazhi_juzhen(j-3:j,:);
                    Ft_2_biaoge=Ft_2_juzhen(j-3:j,:);
                end
                set(handles.uitable1,'Data',u_chazhi_biaoge)
                set(handles.uitable2,'Data',Ft_2_biaoge)
                %==================================================================
                j=j+1;
                pause(0.1)
                guidata(hObject, handles);
%               huancun=s.BytesAvailable
                if mod(j,100)==0
                qinghuancun=fread(s,s.BytesAvailable);
%               huancun=s.BytesAvailable
                end
            end
        end
  else
    try
        biaoji=2;
        fclose(s);
        delete(s)
%         clear(s)
        set(handles.pushbutton4,'string','打开串口');
        msgbox(['关闭',handles.duankou,'成功']);
    catch err
        msgbox('关闭失败');
    end
end


% --- Executes on button press in pushbutton5.

function edit1_CreateFcn(hObject, eventdata, handles)
% hObject    handle to edit1 (see GCBO)
% eventdata  reserved - to be defined in a future version of MATLAB
% handles    empty - handles not created until after all CreateFcns called

% Hint: edit controls usually have a white background on Windows.
%       See ISPC and COMPUTER.
if ispc && isequal(get(hObject,'BackgroundColor'), get(0,'defaultUicontrolBackgroundColor'))
    set(hObject,'BackgroundColor','white');
end

function edit2_CreateFcn(hObject, eventdata, handles)
% hObject    handle to edit2 (see GCBO)
% eventdata  reserved - to be defined in a future version of MATLAB
% handles    empty - handles not created until after all CreateFcns called

% Hint: edit controls usually have a white background on Windows.
%       See ISPC and COMPUTER.
if ispc && isequal(get(hObject,'BackgroundColor'), get(0,'defaultUicontrolBackgroundColor'))
    set(hObject,'BackgroundColor','white');
end

function edit3_CreateFcn(hObject, eventdata, handles)
% hObject    handle to edit3 (see GCBO)
% eventdata  reserved - to be defined in a future version of MATLAB
% handles    empty - handles not created until after all CreateFcns called

% Hint: edit controls usually have a white background on Windows.
%       See ISPC and COMPUTER.
if ispc && isequal(get(hObject,'BackgroundColor'), get(0,'defaultUicontrolBackgroundColor'))
    set(hObject,'BackgroundColor','white');
end
果然,今天调试时有了两个串口,就出错了,因为是cell类型的,所以传递不了,用char强制转换为string的就行了。具体的将上述第63行改为 s=serial(char(handles.duankou));即可

刚开始学习这方面,很多不懂的,功能都是凑出来的,如果哪位大神觉得有改进的地方,欢迎指出。