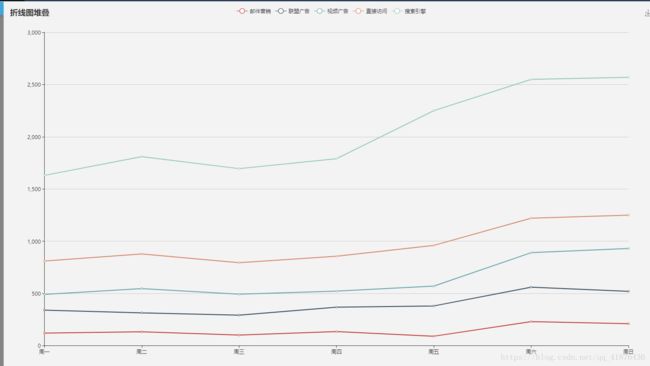
ECharts部分属性说明--持续更新
一、示例图表属性
option = {
    title: {
        text: '折线图堆叠'
    },
    tooltip: {
        trigger: 'axis'
    },
    legend: {
        data:['邮件营销','联盟广告','视频广告','直接访问','搜索引擎']
    },
    grid: {
        left: '3%',
        right: '4%',
        bottom: '3%',
        containLabel: true
    },
    toolbox: {
        feature: {
            saveAsImage: {}
        }
    },
    xAxis: {
        type: 'category',
        boundaryGap: false,
        data: ['周一','周二','周三','周四','周五','周六','周日']
    },
    yAxis: {
        type: 'value'
    },
    series: [
        {
            name:'邮件营销',
            type:'line',
            stack: '总量',
            data:[120, 132, 101, 134, 90, 230, 210]
        },
        {
            name:'联盟广告',
            type:'line',
            stack: '总量',
            data:[220, 182, 191, 234, 290, 330, 310]
        },
        {
            name:'视频广告',
            type:'line',
            stack: '总量',
            data:[150, 232, 201, 154, 190, 330, 410]
        },
        {
            name:'直接访问',
            type:'line',
            stack: '总量',
            data:[320, 332, 301, 334, 390, 330, 320]
        },
        {
            name:'搜索引擎',
            type:'line',
            stack: '总量',
            data:[820, 932, 901, 934, 1290, 1330, 1320]
        }
    ]
};
属性说明
- title图表标题属性
 title:{
        text:"XXX图",//图表名
        x: 'center',//水平位置
        y: '20px',//垂直位置
        position: 'top'//标题位置
}
2.提示框
tooltip : { //显示提示框
        trigger : 'axis'
},
3.legend图例
legend : {
        data : legendData,//图例名,legendData为数组,可以是动态
        //y: "center",
        //x: "top",
        top : 40,
        orient : "horizontal"//图例位置-horizontal水平显示,vertical垂直显示
    },
    color : xcolor ,//图例颜色[ '#2B94FF', '#47D700', '#ff2424', '#ffd100']
    //color为图例的不同显示颜色,可以是动态数组。颜色用#十六进制表示(如果图例线数大于图例颜色数,则从头循环显示)
legendData数组内容可调节
{
    name:"XXX", //图例名,可以是动态数组
    icon:"circle" //图例样式,circle为实心圆
    textStyle:{
        fontSize:15  //图例文字大小px
    }
}
4.grid图的位置
grid : {
        y : '80px' //直角坐标系内绘图网格左上角纵坐标,默认值60
},toolbox: {
show: true,
orient:"vertical",
feature: {
dataView: {//数据视图
show: true,
readOnly: false
},
magicType: {
show: true,
type: ['line', 'bar']
},
restore: {//还原图表,刷新
show: true
},
saveAsImage: {//保存图表为图片
show: true,
backgroundColor: 'transparent'
}
}
}, 6.X轴属性
    xAxis : {
        /* type: 'category', *///X轴数据类型,数字or日期
        position : 'right',
        data : limits,//X显示节点数组
        boundaryGap : false,
        axisLabel : {
            showMaxLabel : true,//显示最大一个节点
            textStyle:{
                fontSize:13  //调整x轴字体大小px
            }
        },
    },
7.Y轴属性
yAxis : {
    type : 'value',
    min : 0,//最小刻度
    max : 150,//最大刻度
    axisLabel : {
        showMaxLabel : true,
        textStyle:{
            fontSize:13  //调整Y轴字体大小px
        }
    }
},
8.图中心数据
series: [
        {
            name:'邮件营销',//数据名
            type:'line',//显示类型,线
            stack: '总量',
            data:[120, 132, 101, 134, 90, 230, 210]//数据
        },
        {
            name:'联盟广告',
            type:'line',
            stack: '总量',
            data:[220, 182, 191, 234, 290, 330, 310]
        }
     ]
series数据设置
{
    name:"",
    type:"",
    itemStyle:{
        normal:{
            label:{
                show:"true",//是否显示线
            },
            lineStyle:{
                width:5,//线宽度
                color:"#fff" //线颜色
            }
        }
    }
}
2.图表补充说明
1.图表X轴显示的刻度数,和图表所在的div宽度有直接关联

