自定义控件-- 折线图--Android
继续我们的控件重写哈、 前阵子重写了个【柱状图】, 今天就看看这个【折线图】到底怎么整、 原理是一样的
柱状图的实现: http://blog.csdn.net/quanjin24k/article/details/10683557
今天依然没有用aChartEngine, 纯手工绘制;
绘制分析:
1.折线图讲求的也是一个坐标轴对称的一个概念,只要将这个换算做到位, 剩余工作就是体力活-绘制了;
2.明确折线图的元素,X轴,Y轴,刻度值,名称, 背景线,其他点缀情况;站在面向对象的角度来思考,这些都是对象的属性哈
3.重写的话, 必然要extends View, 自己手工draw了------所有的元素都是自己绘制出来的哈;
按照惯例, 先爆几张果照瞅瞅~~
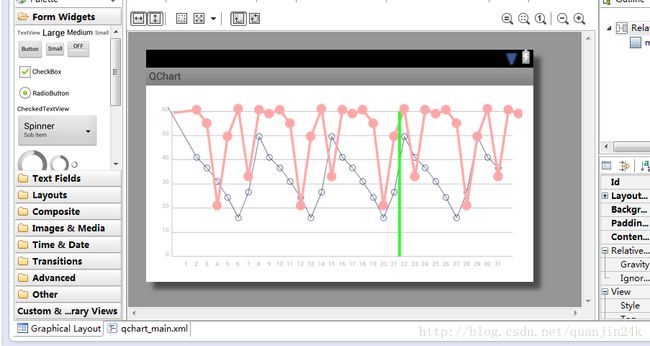
1.原生态绘制出来, 未经美化的折线图就是这个样子滴---------------------------
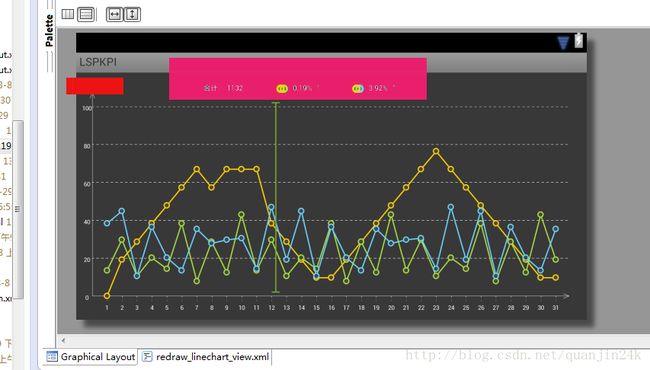
2.经过一番雕琢后, 业余美工处理【自己哈】,然后真正美工的配色,显示效果是这个样子滴------------
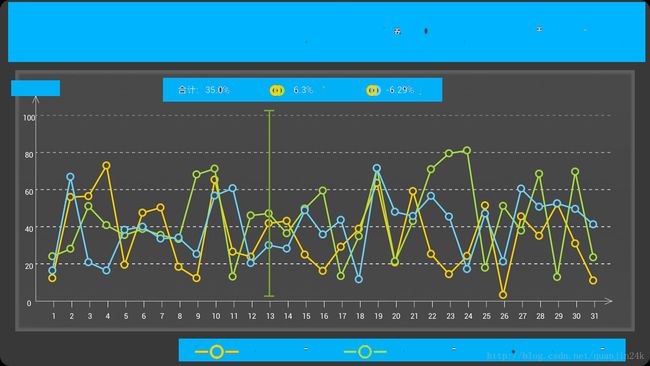
3.上面是单纯的控件调整, 真正的在UI中的使用情况是这样的---------------------------
呵呵, 看完了这几张图, 有什么感想呢? 是不是也想亲自试验下? 都说Android的绘图是UI的高级技巧,毕竟其中涉及到好多的算法,不是简单的拖拖拽拽了;
那又如何? 生画!
先分析一下这个lineChart吧-----------把目光集中到折线上, 其他地方无视就好哈--毕竟不能100%的呈现--凑合着看:
1. 界面元素重新确定: X, Y, 刻度值, 背景线, 其他一些元素【看具体需求】;
2.配色- 每根线的具体色调;
3.背景线------虚线实现, 也不难,就是对path进行处理一下就好-------详情见下文代码---或者参阅本人另一博客;
4.折线拐点处的圆环如何流畅的衔接?算法实现, 不是简单的折线弯曲;
【注】:
1.我们现在写的是一个控件,要有可扩展性;不能说XY轴被限定死,要可以动态的切换、伸展,那么这其中的工作量就大了·········真的很大···········因为你要对其动态数据进行实时判断,然后根据最值进行均分--刻度赋值,相应的折线的拐点也要用算法进行判断,28、29、30、31个点; 甚至0个点都是有可能的, 因为数据是从外界获取的, 不是简单的模拟数据; 这就考验一个程序员在对待如此要命的时候的耐性跟毅力了,扛过去了 万事ok,若懈怠了 前功尽弃;说白了, 就是拼算法+信心!
2.因为是自己重写的控件,所以可能在不同手机加载的时候会有显示上的走偏, 所以要根据手机的不同分辨率来坐适当判断、修改,毕竟自己重写的控件没有原生态的兼容性强;可以在代码运行时动态判断各种分辨率--最笨的法子;、
3.真正的需求是体现折线图的【过渡效果】,可以看到上一次的折线情况, 从上次状态缓慢变化到当前状态------要有【动态变化】的过程!!! 简单不??? 什么? 简单? 不会吧?其实也是拼算法的个过程,runnable+handler--线程控制增量,handler进行控件的刷新View.invalidate(),来实时的更新控件View的样式;
好啦, 说的差不多了, 应该可以上代码了, 首先看看刚开始那个粗糙-【未雕琢的实现代码】--原生态哦~~:
package com.quanjin.qchart.view;

import android.content.Context;
import android.graphics.Canvas;
import android.graphics.Color;
import android.graphics.Paint;
import android.graphics.Paint.Align;
import android.graphics.Paint.Style;
import android.graphics.RectF;
import android.util.AttributeSet;
import android.util.Log;
import android.view.MotionEvent;
import android.view.View;
import android.view.ViewGroup.LayoutParams;
import android.widget.LinearLayout;

public class MyDrawChartView extends View{

	public float s = 500;//默认中间线位置
	private boolean isTouched = false;//中间线点击位置变化控制

	private static final String[] SPPED_SCALES = new String[] { "0", "20", "40", "60", "80", "100", "120" ,"140"};
	private static final String[] SPPED_SCALES1 = new String[] { "0", "10", "20", "30", "40", "50", "60" ,"70"};

	private float[] points = new float[] { 33, 50, 59, 70, 83.5f, 100, 79
			 							  ,33, 50, 59, 70, 83.5f, 100, 79
			 							  ,33, 50, 59, 70, 83.5f, 100, 79
			 							  ,33, 50, 59, 70, 83.5f, 100, 79
			 							  ,33, 50, 59};
    private String[] dates = new String[] { "12/1", "12/2", "12/3", "12/4", "12/5", "12/6", "12/7"
    										,"12/8", "12/9", "12/10", "12/11", "12/12", "12/13", "12/14"
    										,"12/15", "12/16", "12/17", "12/18", "12/19", "12/20", "12/21"
    										,"12/22", "12/23", "12/24", "12/25", "12/26", "12/27", "12/28"
    										,"12/29", "12/30", "12/31"};
    private String[] dates1 = new String[] { "1", "2", "3", "4", "5", "6", "7"
			,"8", "9", "10", "11", "12", "13", "14"
			,"15", "16", "17", "18", "19", "20", "21"
			,"22", "23", "24", "25", "26", "27", "28"
			,"29", "30", "31"};

    private float[] secondPoints = new float[]{14, 11, 22, 90, 33, 10, 66, 11
    										  ,14, 11, 22, 90, 33, 10, 66, 11
    										  ,14, 11, 22, 90, 33, 10, 66, 11
    										  ,14, 11, 22, 90, 33, 10, 66, 11
    										  ,14, 11, 22};

	public MyDrawChartView(Context context) {
		// TODO Auto-generated constructor stub
		super(context);
	}

	public MyDrawChartView(Context context, AttributeSet attrs) {
		// TODO Auto-generated constructor stub
		super(context, attrs);
	}

	public MyDrawChartView(Context context, AttributeSet attrs, int defStyle) {
		super(context, attrs, defStyle);
		// TODO Auto-generated constructor stub
	}

	public void setData(int parentWidth, float[] points, String[] dates) {
		this.points = points;
		this.dates = dates1;

		if(points.length == 7) {
			LinearLayout.LayoutParams layoutParams = new LinearLayout.LayoutParams(LayoutParams.WRAP_CONTENT, LayoutParams.WRAP_CONTENT);
			layoutParams.height = this.getHeight();//
			layoutParams.width = parentWidth;//this.getWidth();
			setLayoutParams(layoutParams);
		} else if(points.length > 7) {
			int xSpace = (parentWidth - 20) / 10;
			int width = xSpace * points.length + 20 + 30;
			LinearLayout.LayoutParams layoutParams = new LinearLayout.LayoutParams(LayoutParams.WRAP_CONTENT, LayoutParams.WRAP_CONTENT);
			layoutParams.height = this.getHeight();
			layoutParams.width = width;
			setLayoutParams(layoutParams);
		}
	}

	@Override
	protected void onDraw(Canvas canvas) {
		super.onDraw(canvas);

		float gridX = 30;
		float gridY = getHeight() - 30;
		float gridWidth = getWidth() - 20;
	    float gridHeight = getHeight() - 60;
	    float beginX = gridX + 30;
	    float xSpace = (gridWidth - beginX - 30) / (this.points.length - 1);
		float ySpace = gridHeight/6;

		//
		Paint paint = new Paint();
		paint.setAntiAlias(true);
		paint.setColor(Color.rgb(157, 157, 157));
		paint.setTextSize(12);
		paint.setTextAlign(Align.RIGHT);

		//
		float x1 = gridX;
		float x2 = gridWidth;
		float y;
		for(int n = 0; n < SPPED_SCALES1.length; n++) {
			y = gridY - n * ySpace;

			//
			canvas.drawLine(x1, y, x2, y, paint);
			canvas.drawText(SPPED_SCALES1[n], x1 - 6, y, paint);
		}

		//画一条垂直线, 即y轴。
		canvas.drawLine(gridX, gridY, gridX, gridY - gridHeight, paint);
//		paint.setColor(Color.GREEN);
//		paint.setStrokeWidth(3);
//		canvas.drawLine(s, gridY, s, gridY - gridHeight, paint);

		paint.setColor(Color.rgb(157, 157, 157));
		//
		float x;
		y = gridY + 20;
		paint.setTextAlign(Align.CENTER);
		for(int n = 0; n < dates1.length; n++) {
			//get x
			x = beginX + n * xSpace;
			// draw y text
			canvas.drawText(dates1[n], x, y, paint);
		}

		float lastPointX = 22;
		float lastPointY = 22;
		float currentPointX;
		float currentPointY;

		RectF pointRect = new RectF();

		paint.setColor(Color.rgb(5, 21, 67));
		paint.setStyle(Style.STROKE);//空心圆
		//绘制第一条线
		for(int n = 0; n < dates1.length; n++) {
			//get Current Point
			currentPointX = beginX + n * xSpace;
			currentPointY = points[n] / 120 * gridHeight;

			//draw line
			if(n > 0) {
				canvas.drawLine(lastPointX, lastPointY, currentPointX, currentPointY, paint);
				lastPointX = currentPointX;
				lastPointY = currentPointY;
				canvas.drawCircle(lastPointX, lastPointY, 6, paint);
//				canvas.drawCircle(currentPointY, currentPointY, 10, paint);
			}

			/*
			//save point
			lastPointX = currentPointX;
			lastPointY = currentPointY;

			// get point rectangle
			pointRect.left = currentPointX - 3;
			pointRect.top = currentPointY - 3;
			pointRect.right = currentPointX + 6;
			pointRect.bottom = currentPointY + 6;

			// draw 矩形 point
			canvas.drawRect(pointRect, paint);*/
		}

		//重新初始化点、
		lastPointX = 33;
		lastPointY = 33;
		currentPointX = 40;
		currentPointY = 40;

		paint.setStyle(Style.FILL);//实心圆、
		paint.setStrokeWidth(5);//线宽
		paint.setColor(Color.rgb(255, 151, 151));//线颜色、
	    //绘制第二条线、
		for(int n = 0; n < secondPoints.length; n++) {
			//get Current Point
			currentPointX = beginX + n * xSpace;
			currentPointY = secondPoints[n] / 120 * gridHeight;

			//draw line
			if(n > 0) {
				canvas.drawLine(lastPointX, lastPointY, currentPointX, currentPointY, paint);
				lastPointX = currentPointX;
				lastPointY = currentPointY;
				canvas.drawCircle(lastPointX, lastPointY, 10, paint);
			}
		}

		//中间线--
		paint.setColor(Color.GREEN);
		paint.setStrokeWidth(6);
		canvas.drawLine(s, gridY, s, gridY - gridHeight, paint);
	}

	//监听手势、
	@Override
	public boolean onTouchEvent(MotionEvent event) {
		switch(event.getAction()) {
		case MotionEvent.ACTION_DOWN:
			Log.i("action-down", " action-down");
			if(event.getX() >=(s-50) && event.getX() <= (s+50)) {
				isTouched = true;
			}
			break;
		case MotionEvent.ACTION_MOVE:
			Log.i("action-move", " action-move");
			if(isTouched) {
				s = event.getX();//将此时手势x坐标记录下来, 根据此x重绘中间线、
				invalidate();
			}
			break;
		case MotionEvent.ACTION_UP:
			Log.i("action-up", " action-up");
			isTouched = false;
			s = event.getX();//记录当下位置坐标
			break;
		}

		return true;
	}

}
~~~~~~~~~~~~~此处只是简单的用一些傻瓜式的循环数据来填充一下; 而且坐标转换也没处理, 所以就呈现了本文的第一张比较笨拙的折线;
好啦, 重点来啦!!!!!! 下面是经过精雕细琢之后的实现~~ 一切尽在代码中~~~只是因为我们之前介绍过重写原理、、
坐标换算+XY刻度+名称+折线精度+拐点圆圈衔接+配色+XY动态扩展[算法实现]+折线图双击处理+滑动处理····其他特色;
package com.broadtext.lspkpi.view;

import android.annotation.SuppressLint;
import android.content.Context;
import android.graphics.Canvas;
import android.graphics.Color;
import android.graphics.DashPathEffect;
import android.graphics.Paint;
import android.graphics.Paint.Align;
import android.graphics.Paint.Style;
import android.graphics.Path;
import android.graphics.PathEffect;
import android.util.AttributeSet;
import android.util.Log;
import android.view.MotionEvent;
import android.view.View;

import com.broadtext.lspkpi.MainLSPKPIActivity;

/**
 * 折线图
 * @author  24K
 * @created 2013年8月14日15:11:52
 * @version 1.0
 */
@SuppressLint({ "DrawAllocation", "FloatMath" })
public class ReDrawLineChartView extends View{

	public float s = 500;//默认中间线位置
	private boolean isTouched = false;//中间线点击位置变化控制

	private String[] SPPED_SCALES1 = new String[6];//{ "0", "10", "20","30", "40","120"};
	private String[] dates1 = new String[] { "1", "2", "3", "4", "5", "6", "7","8", "9", "10", "11", "12", "13", "14","15", "16",
		     							     "17", "18", "19", "20", "21" ,"22", "23", "24", "25", "26", "27", "28","29", "30", "31"};
	//这3组只是[替代数据]-非真实数据,仅仅是为了在绘图过程中方便[查看效果]。
//	public float[] firstPoints = {33, 14, 21, 11, 40, 15, 39 ,8, 45, 35,33, 14, 21, 11, 40,
//	         15, 39 ,8, 45, 35,33, 14, 21, 11, 40, 15, 39 ,8, 45, 35,22};
	public float[] firstPoints = {0,20,30,40,50,60,70,60, 70,70,70,40,30,20,10, 10,20,30,40,50,60,70,80, 70,60,50,40,30,20,10, 10,20,30,40,50,60,70,80, 70,60,50,40,30,20,10};
    public float[] secondPoints = {14, 31, 11, 21, 15, 40, 8, 30, 13, 45,14, 31, 11, 21, 15,
            40, 8, 30, 13, 45,14, 31, 11, 21, 15, 40, 8, 30, 13, 45,20};
    public float[] thirdPoints = {40, 47, 11, 38, 21, 14, 37, 29, 31, 32, 15, 49,20, 47, 11,
	         38, 21, 14, 37, 29, 31, 32, 15, 49,20, 47, 11, 38, 21, 14, 37};

    private Paint linePaint = new Paint();//背景线。
    private Paint textPaint = new Paint();//文字
    private Paint yChartPaint = new Paint();//Y轴标题。
    private Paint circleRedBlueGreenPaint = new Paint();//环形画笔。
    private Paint circelPaint = new Paint();//拐点圆圈。
    private Paint innerCircelPaint = new Paint();//内圆。
    private Paint chartLinePaint = new Paint();//第一条线
    private Paint secondChartPaint = new Paint();//第二条线。
    private Paint thirdChartPaint = new Paint();//第三条线。
    private Paint centerLinePaint = new Paint();//中间竖线。

    private String totalChartNum = "1132";
    private String tongbiRatio = "0.19%";
    private String huanbiRatio = "3.92%";

    private int leftDirectionId = 1;//上面箭头方向。
	private int rightDirectionId = 1;//下面箭头方向


    public ReDrawLineChartView(Context context) {
		// TODO Auto-generated constructor stub
		super(context);
	}

	public ReDrawLineChartView(Context context, AttributeSet attrs) {
		super(context, attrs);

	}

	public ReDrawLineChartView(Context context, AttributeSet attrs, int defStyle) {
		super(context, attrs, defStyle);
	}

	//setters
	public void setTotalChartNum(String totalChartNum) {
		this.totalChartNum = totalChartNum;
	}

	public void setTongbiRatio(String tongbiRatio) {
		this.tongbiRatio = tongbiRatio;
	}

	public void setHuanbiRatio(String huanbiRatio) {
		this.huanbiRatio = huanbiRatio;
	}

	//控制上下箭头的指向。
	public void setLeftArrowDirection(int upDirectionId) {
		this.leftDirectionId = upDirectionId;
	}

	public void setRightArrowDirection(int downDirectionId) {
		this.rightDirectionId = downDirectionId;
	}

	//进行真实数据赋值。
	public void setData(float[] firstPoints, float[] secondPoints, float[] thirdPoints) {
		this.firstPoints = firstPoints;
		this.secondPoints = secondPoints;
		this.thirdPoints = thirdPoints;
	}

	@Override
	protected void onDraw(Canvas canvas) {
		super.onDraw(canvas);
		//绘制模式-虚线作为背景线。
		PathEffect effect = new DashPathEffect(new float[] { 6, 6, 6, 6, 6}, 2);
		//背景虚线路径.
		Path path = new Path();

		linePaint.setStyle(Style.STROKE);
		linePaint.setStrokeWidth((float)0.7);
		linePaint.setColor(Color.WHITE);
		linePaint.setAntiAlias(true);// 锯齿不显示
		textPaint.setStyle(Style.FILL);// 设置非填充
		textPaint.setStrokeWidth(1);// 笔宽5像素
		textPaint.setColor(Color.WHITE);// 设置为蓝笔
		textPaint.setAntiAlias(true);// 锯齿不显示
		textPaint.setTextAlign(Align.CENTER);
		textPaint.setTextSize(15);
		yChartPaint.setStyle(Style.FILL);
		yChartPaint.setStrokeWidth(1);
		yChartPaint.setColor(Color.WHITE);
		yChartPaint.setAntiAlias(true);
		yChartPaint.setTextAlign(Align.CENTER);
		yChartPaint.setTextSize(18);
		circelPaint.setStyle(Style.FILL);
		circelPaint.setStrokeWidth(2);
		circelPaint.setColor(Color.YELLOW);
		circelPaint.setAntiAlias(true);
		innerCircelPaint.setStyle(Style.FILL);
		innerCircelPaint.setStrokeWidth(1);
		innerCircelPaint.setColor(Color.parseColor("#464646"));
		innerCircelPaint.setAntiAlias(true);
		chartLinePaint.setStyle(Style.FILL);
		chartLinePaint.setStrokeWidth(3);
		chartLinePaint.setColor(Color.rgb(255, 210, 0));//(1)黄色
		chartLinePaint.setAntiAlias(true);
		secondChartPaint.setStyle(Style.FILL);
		secondChartPaint.setStrokeWidth(3);
		secondChartPaint.setColor(Color.rgb(169, 222, 63));//(2)绿色
		secondChartPaint.setAntiAlias(true);
		thirdChartPaint.setColor(Color.rgb(108, 212, 255));//(3)蓝色
		thirdChartPaint.setStrokeWidth(3);
		thirdChartPaint.setStyle(Style.FILL);
		thirdChartPaint.setAntiAlias(true);
		centerLinePaint.setColor(Color.parseColor("#7DA62D"));//中间动态线。
		centerLinePaint.setStrokeWidth(3);

		circleRedBlueGreenPaint.setStrokeWidth(6);
		circleRedBlueGreenPaint.setAntiAlias(true);//消除锯齿。
		circleRedBlueGreenPaint.setStyle(Style.STROKE);
		circleRedBlueGreenPaint.setColor(Color.parseColor("#4692B1"));//

		//TODO 算Y轴的刻度。
		float tempLine1Max = getMaxNumFromArr(firstPoints);
		float tempLine2Max = getMaxNumFromArr(secondPoints);
		float tempLine3Max = getMaxNumFromArr(thirdPoints);

		//刻度的最大值。
		float maxNum = getMaxNumOfThree(tempLine1Max, tempLine2Max, tempLine3Max);//先算出最大值。
		float finalMaxNum = getRelativeNum(maxNum);//根据最大值找出临近的最大值--方便Y刻度标注。
		for(int i = 0; i <= 5; i++) {//循环对Y刻度赋值。便于显示。
			if(maxNum >= 0 && maxNum < 1) {
				SPPED_SCALES1[i] =  String.valueOf((int)((float)finalMaxNum/5*i)) + "%";//百分数的Y轴刻度。
			} else {
				SPPED_SCALES1[i] =  String.valueOf(0 + (int)((float)finalMaxNum/5*i));
			}
		}

		//基准点。
		float gridX = 30+10;
		float gridY = getHeight() - 30;
		//XY间隔。
		float xSpace = (float) ((getWidth()-60)/31-1.5);
		float ySpace = (getHeight()-160)/(SPPED_SCALES1.length-1)+3;
		//画Y轴(带箭头)。
		canvas.drawLine(gridX, gridY-20-10, gridX, 30+20, linePaint);
		canvas.drawLine(gridX, 30+20, gridX-6, 30+14+20, linePaint);//Y轴箭头。
		canvas.drawLine(gridX, 30+20, gridX+6, 30+14+20, linePaint);
		//画Y轴名字。
		canvas.drawText("客流数", gridX, 50-5, yChartPaint);
		//TODO 【最上方】一栏。"1132"
		canvas.drawText("合计:", gridX+300, 50-5, yChartPaint);
		canvas.drawText(totalChartNum, gridX+300+50+5+3, 50-5, yChartPaint);
		//第一个对比环-yellow-green(1)
		circleRedBlueGreenPaint.setColor(Color.rgb(169, 222, 63));//绿色(底环)。
		canvas.drawCircle(gridX+300+180, 30+20-10, 8, circleRedBlueGreenPaint);
		circleRedBlueGreenPaint.setColor(Color.rgb(255, 210, 0));//黄色(上环)。
		canvas.drawCircle(gridX+300+180-8, 30+20-10, 8, circleRedBlueGreenPaint);
		//red-green-右侧百分比(1)"0.19%"
		canvas.drawText(tongbiRatio, gridX+300+180-8+50+5, 50-5, yChartPaint);
		yChartPaint.setColor(Color.rgb(169, 222, 63));//将头颜色--底色--绿
		if(leftDirectionId > 0) {
			canvas.drawText("↑", gridX+300+180-8+85+10, 50-5, yChartPaint);
		} else {
			canvas.drawText("↓", gridX+300+180-8+85+10, 50-5, yChartPaint);
		}

		//第二个对比环-red-blue(2)
		circleRedBlueGreenPaint.setColor(Color.rgb(108, 212, 255));//蓝色(底环)。
		canvas.drawCircle(gridX+300+180+50+50+50+50-10, 30+20-10, 8, circleRedBlueGreenPaint);
		circleRedBlueGreenPaint.setColor(Color.rgb(255, 210, 0));//黄色(上环)。
		canvas.drawCircle(gridX+300+180+50+50+50+50-10-8, 30+20-10, 8, circleRedBlueGreenPaint);
		//red-blue-右侧百分比(2)"3.92%"
		yChartPaint.setColor(Color.parseColor("#ffffffff"));//字体白色。
		canvas.drawText(huanbiRatio, gridX+300+180+50+50+50+50-10-8+50+5, 50-5, yChartPaint);
		yChartPaint.setColor(Color.rgb(108, 212, 255));//箭头颜色--底色--蓝色。
		if(rightDirectionId > 0) {
			canvas.drawText("↑", gridX+300+180+50+50+50+50-10-8+85+10, 50-5, yChartPaint);
		} else {
			canvas.drawText("↓", gridX+300+180+50+50+50+50-10-8+85+10, 50-5, yChartPaint);
		}

		float y = 0;//Y间隔。
		//画X轴+背景虚线。
		y = gridY-20;
		canvas.drawLine(gridX, y-10, getWidth()-55+10, y-10, linePaint);//X轴.
		canvas.drawLine(getWidth()-55+10, y-10, getWidth()-55-14+10, y-6-10, linePaint);//X轴箭头。
		canvas.drawLine(getWidth()-55+10, y-10, getWidth()-55-14+10, y+6-10, linePaint);
		for(int n = 0; n < SPPED_SCALES1.length; n++) {
			y = gridY-20 - n * ySpace;
			linePaint.setPathEffect(effect);//设法虚线间隔样式。
			//画除X轴之外的------背景虚线-------
			if(n > 0) {
				path.moveTo(gridX, y-10);//背景【虚线起点】。
				path.lineTo(getWidth()-55+10, y-10);//背景【虚线终点】。
				canvas.drawPath(path, linePaint);
			}
			//画Y轴刻度。
			canvas.drawText(SPPED_SCALES1[n], gridX-6-7, y, textPaint);
		}
		//绘制X刻度坐标。
		float x = 0;
		if(dates1[0] != null) {
			for(int n = 0; n < dates1.length; n++) {
				//取X刻度坐标.
				x = gridX + (n+1) * xSpace;//在原点(0,0)处不画刻度,向右移动一个跨度。
				//画X轴具体刻度值。
				if(dates1[n] != null) {
					canvas.drawLine(x, gridY-30, x, gridY-18, linePaint);//短X刻度。
					canvas.drawText(dates1[n], x, gridY+5, textPaint);//X具体刻度值。
				}
			}
		}

		//起始点。
		float lastPointX = 0;
		float lastPointY = 0;
		float currentPointX = 0;
		float currentPointY = 0;
		if(firstPoints != null) {
			//1.绘制第一条折线。
			for(int n = 0; n < dates1.length; n++) {
				//get current point
				currentPointX =  n * xSpace + xSpace+xSpace+2;
//				currentPointY =  (float)(getHeight()-ySpace*3/4) - (float)firstPoints[n] / 60 * (this.getHeight() - ySpace)-(float)2.5;
//				currentPointY =  (1 - (float)firstPoints[n]/80) * (gridY-40);
				currentPointY =  (float)(getHeight()-40)-15-5 - (float)firstPoints[n]/((float)1.6*maxNum) * (getHeight()-40);
				//draw line
				if(n > 0) {
					canvas.drawLine(lastPointX, lastPointY, currentPointX, currentPointY, chartLinePaint);//第一条线[蓝色]
				}
				lastPointX = currentPointX;
				lastPointY = currentPointY;
			}
			for(int n = 0; n < dates1.length; n++) {
				//get current point
				currentPointX =  n * xSpace + xSpace+xSpace+2;
//				currentPointY =  (float)(getHeight()-ySpace*3/4) - (float)firstPoints[n] / 60 * (this.getHeight() - ySpace)-(float)2.5;
//				currentPointY =  (1 - (float)firstPoints[n]/80) * (gridY-30);
				currentPointY =  (float)(getHeight()-40)-15-5 - (float)firstPoints[n]/((float)1.6*maxNum) * (getHeight()-40);
				//draw line
				circelPaint.setColor(Color.rgb(255, 210, 0));//(1)黄色
				canvas.drawCircle(lastPointX, lastPointY, 8, circelPaint);
				canvas.drawCircle(lastPointX, lastPointY, 5, innerCircelPaint);
				lastPointX = currentPointX;
				lastPointY = currentPointY;
			}
		}

		//重置起始点。
		lastPointX = 0;//gridX+10;
		lastPointY = 0;//gridY-90;
		currentPointX = 0;
		currentPointY = 0;

		if(secondPoints != null) {
			//2.绘制第二条折线。
			for(int n = 0; n < dates1.length; n++) {
				//get current point
				currentPointX =  n * xSpace + xSpace+xSpace+2;
//				currentPointY =  (float)(getHeight()-ySpace*3/4) - (float)secondPoints[n] / 60 * (this.getHeight() - ySpace)-(float)2.5;
				currentPointY =  (float)(getHeight()-40)-15-5 - (float)secondPoints[n]/((float)1.6*maxNum) * (getHeight()-40);
				//draw line
				if(n > 0) {
					canvas.drawLine(lastPointX, lastPointY, currentPointX, currentPointY, secondChartPaint);//第二条线[绿色]
				}
				lastPointX = currentPointX;
				lastPointY = currentPointY;
			}
			for(int n = 0; n < dates1.length; n++) {
				//get current point
				currentPointX =  n * xSpace + xSpace+xSpace+2;
//				currentPointY =  (float)(getHeight()-ySpace*3/4) - (float)secondPoints[n] / 60 * (this.getHeight() - ySpace)-(float)2.5;
				currentPointY =  (float)(getHeight()-40)-15-5 - (float)secondPoints[n]/((float)1.6*maxNum) * (getHeight()-40);
				//draw line
				circelPaint.setColor(Color.rgb(169, 222, 63));//(2)绿色
				canvas.drawCircle(lastPointX, lastPointY, 8, circelPaint);
				canvas.drawCircle(lastPointX, lastPointY, 5, innerCircelPaint);
				lastPointX = currentPointX;
				lastPointY = currentPointY;
			}
		}

		//重置起始点。
		lastPointX = 0;//gridX+10;
		lastPointY = 0;//gridY-240;
		currentPointX = 0;
		currentPointY = 0;

		if(thirdPoints != null) {
			//3.绘制第三条折线。
			for(int n = 0; n < dates1.length; n++) {
				//get current point
				currentPointX =  n * xSpace + xSpace+xSpace+2;
//				currentPointY =  (float)(getHeight()-ySpace*3/4) - (float)thirdPoints[n] / 60 * (this.getHeight() - ySpace)+(float)4.0;
				currentPointY =  (float)(getHeight()-40)-15-5 - (float)thirdPoints[n]/((float)1.6*maxNum) * (getHeight()-40);
				//draw line
				if(n > 0) {
					canvas.drawCircle(lastPointX, lastPointY, 5, thirdChartPaint);
					canvas.drawLine(lastPointX, lastPointY, currentPointX, currentPointY, thirdChartPaint);//第三条线[橙色]
				}
				lastPointX = currentPointX;
				lastPointY = currentPointY;
			}
			for(int n = 0; n < dates1.length; n++) {
				//get current point
				currentPointX =  n * xSpace + xSpace+xSpace+2;
//				currentPointY =  (float)(getHeight()-ySpace*3/4) - (float)thirdPoints[n] / 60 * (this.getHeight() - ySpace)+(float)4.0;
				currentPointY =  (float)(getHeight()-40)-15-5 - (float)thirdPoints[n]/((float)1.6*maxNum) * (getHeight()-40);
				//draw line
				circelPaint.setColor(Color.rgb(108, 212, 255));//(3)蓝色
				canvas.drawCircle(lastPointX, lastPointY, 8, circelPaint);
				canvas.drawCircle(lastPointX, lastPointY, 5, innerCircelPaint);
				lastPointX = currentPointX;
				lastPointY = currentPointY;
			}
		}

		//中间竖直线--
		canvas.drawLine(s, gridY-40, s, gridY-5*ySpace-40, centerLinePaint);
		canvas.drawLine(s-10, gridY-40, s+10, gridY-40, centerLinePaint);
		canvas.drawLine(s-10, gridY-5*ySpace-40, s+10, gridY-5*ySpace-40, centerLinePaint);
	}

	int clickCount = 0;
	long firstClickTime = 0;
	long secondClickTime = 0;

	/**
	 * 手势监听--处理双击事件。
	 */
	@Override
	public boolean onTouchEvent(MotionEvent event) {
		switch(event.getAction() & MotionEvent.ACTION_MASK) {
		case MotionEvent.ACTION_DOWN:
			if(MainLSPKPIActivity.isForbidClick) {//当4个titleBtn被按下,禁止对折线图的一切操作。
				clickCount++;
				if(clickCount == 1) {
					firstClickTime = System.currentTimeMillis();
					MainLSPKPIActivity.doubleClick = false;
				} else if(clickCount == 2) {
					secondClickTime = System.currentTimeMillis();
					if(secondClickTime - firstClickTime < 1000) {
						MainLSPKPIActivity.doubleClick = true;
						clickCount = 0;
						firstClickTime = 0;
						secondClickTime = 0;
					} else {
						MainLSPKPIActivity.doubleClick = false;
						clickCount = 0;
						firstClickTime = 0;
						secondClickTime = 0;
					}
				}
				Log.i("action-down", " action-down");
				if(event.getX() >=(s-30) && event.getX() <= (s+30)) {
					isTouched = true;
				}
			}

			break;
		case MotionEvent.ACTION_MOVE:
			Log.i("action-move", " action-move");
			if(!MainLSPKPIActivity.doubleClick)
			if(isTouched) {
				s = event.getX();//将此时手势x坐标记录下来, 根据此x重绘中间线、
				invalidate();
			}
			break;
		case MotionEvent.ACTION_UP:
			Log.i("action-up", " action-up");
			if(!MainLSPKPIActivity.doubleClick) {
				if(isTouched) {
					s = event.getX();//记录当下位置坐标
					isTouched = false;
					invalidate();
				}
			}
			break;
		}

		if(!MainLSPKPIActivity.doubleClick)
			return true;//没双击时-子控件有焦点。
		else
			return false;//将焦点传递给父控件。
	}

	/**
	 * 取数组中的最大元素
	 * @param numArr 取值的数组
	 * @return 返回数组中的最大值。
	 */
	private float getMaxNumFromArr(float[] numArr) {
		float maxNum = numArr[0];
		for(int i = 0; i < numArr.length; i++) {
			if(numArr[i] > maxNum) {
				maxNum = numArr[i];
			}
		}
		return maxNum;
	}

	/**
	 * 返回3个值中的最大值。
	 * @param firstNum  第一个数值
	 * @param secondNum 第二个数值
	 * @param thirdNum  第三个数值
	 * @return  返回传入的3个值中的最大值。
	 */
	private float getMaxNumOfThree(float firstNum, float secondNum, float thirdNum) {
		float maxNum = 0;
		if(firstNum >= secondNum && firstNum >= thirdNum) {
			maxNum = firstNum;
		}
		if(secondNum >= firstNum && secondNum >= thirdNum) {
			maxNum = secondNum;
		}
		if(thirdNum >= firstNum && thirdNum >= secondNum) {
			maxNum = thirdNum;
		}
		return maxNum;
	}

	/**
	 * 根据数组最大值来获取临近最大值--来作为刻度的最大值----方便分配刻度。
	 * @param num 传入的值
	 * @return 返回num附近的整数值, 方便刻度分配。
	 */
	private float getRelativeNum(float num) {
		float desNum = 0;
		if(num >= 0 && num < 1) {
			desNum = 100;
		} else if(num >= 1 && num <= 100) {
			desNum = 100;
		} else if(num > 100 && num < 1000) {
			int num1 = (int)num % 100;//余数-个十位。
			int num2 = (int)num / 100;//高位-百位。
			if(num1 > 0 && num1 <= 50) {
				desNum = num2 * 100 + 50;//取临近的整数值作为Y轴刻度。
			} else if(num1 > 50 && num1 < 100) {
				desNum = num2 * 100 + 100;
			}
		} else if(num >= 1000 && num < 1500) {
			desNum = handleY(num, desNum, 1000);
		} else if(num >= 1500 && num < 2000) {
			desNum = handleY(num, desNum, 1000);
		} else if(num >= 2000 && num < 3000) {
			desNum = handleY(num, desNum, 1000);
		} else if(num >= 3000 && num < 4000) {
			desNum = handleY(num, desNum, 1000);
		} else if(num >= 4000 && num < 5000) {
			desNum = handleY(num, desNum, 1000);
		} else if(num >= 5000 && num < 10000) {
			desNum = handleY(num, desNum, 1000);
		}
		return desNum;
	}

	/**
	 * 具体处理Y轴刻度
	 * @param sourceNum      传入的实际值
	 * @param desNum         要返回的目标值
	 * @param highPostionNum 实际值的最高位
	 * @return 将传入的目标值赋值后返回
	 */
	private float handleY(float sourceNum, float desNum, int highPostionNum) {
		int num1 = (int)sourceNum % highPostionNum;//余数-个十位。
		int num2 = (int)sourceNum / highPostionNum;//高位-百位。
		if(num1 > 0 && num1 <= highPostionNum/2) {
			desNum = num2 * highPostionNum + highPostionNum/2;//取临近的整数值作为Y轴刻度。
		} else if(num1 > highPostionNum/2 && num1 < highPostionNum) {
			desNum = num2 * highPostionNum + highPostionNum;
		}
		return desNum;
	}

}
好啦, 这个就是完整的控件重写代码, 是有点长呵、 不过真正起作用的就是那几行,注释够清楚吧??
1.屏幕坐标--实际坐标的换算----------------
因为X坐标是一样的,对称变换===变的是Y~~ currentPointY = (float)(getHeight()-40)-15-5 - (float)firstPoints[n]/((float)1.6*maxNum) * (getHeight()-40); 这个转换因子就要自己根据比例来拼凑,调试了;
2.处理拐点圆圈衔接时,实现方案~~~ 在两端进行算法加减逻辑处理, 不太容易;
还有个笨办法===线-圈-线-圈-线-圈-线-圈---循环交替着绘制,其中拐点有两个圆圈-大圈套小圈(填充色为背景色-视觉差) 同样可以达到这种效果
3.要实现XY坐标刻度的动态换算, 逻辑-------获取3组数据集合中的最大值【逻辑见实现代码】,再进行均分; 跟据上图你也可以看见,每次的折线高低走势都不同哈
4.当然了,如果你有需求, 画几根折线完全是你说了算, 1跟,2跟,3跟··· 随意条数哈、够可以吧?
5.双击事件其实也就那么回事情===onTouchEvent(MotionEvent event),只是中间要加一些流程控制标记符,判断两次点击时间差是否符合要求;
6.左右滑动的事件处理也差不多,break;case MotionEvent.ACTION_MOVE: 在touch事件中的move动作中按照需求处理下就好;
仔细看看, 没什么了吧、 因为实现了,所以感觉难度就这样; 可能没接触过的人,开始触碰的时候真是有些难以招架,不过原理明白了就好了;
it座右铭, 以共勉~~~
~~~~~~~~~~~~~~~~~~~~~~~~~~~~~~~~~~~~~~~~~~~~~~~~~~~~~~~~~~~~~~~~~~~~~
~~~~~~~~~~~~~唯有压力才能突破, 才能距破茧成蝶之日更近一步~~~~~~~~~~~~~~~~~
~~~~~~~~~~~~~~~~~~~~~~~~~~~~~~~~~~~~~~~~~~~~~~~~~~~~~~~~~~~~~~~~~~~~~


