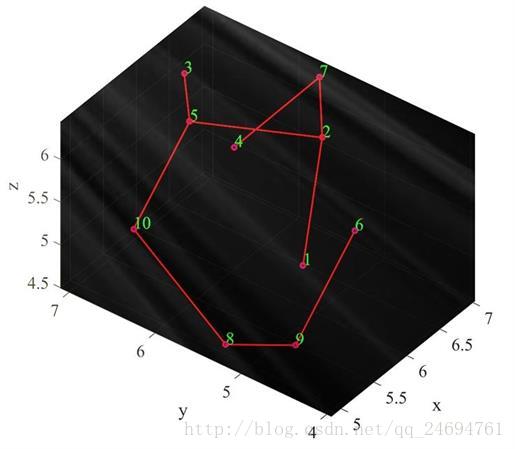
基于并查集+Kruskal算法的matlab程序及最小生成树绘图
学了一天最小生成树,稍稍总结一下,这是第一篇
kruskal算法
关于kruskal算法已有大量的资料,不再赘述,算法流程为:
- 得到邻接矩阵和权值;
- 初始化,连接距离最小的两点;
- 连接距离次小的两点,如果形成回路则取消连接;重复上述连接步骤,直到所有n个节点被n-1条边连接成树。
并查集
关于并查集的可以看一下这篇:《一个很有意思的并查集详解》。
下面给出两个子函数,一个用于寻找根节点(RootNode),一个用于合并(MergeNode)。第二个函数加入了压缩选项,压缩的话计算量小一些,默认为压缩。
需要注意的是,并查集有很多的应用,kruskal只是冰山一角。
%% 并查集
% Node = RootNode(Node,Father)
% 输入:Node:需要查询的节点
%       Father:记录父节点的向量
% 输出:父节点
function Node = RootNode(Node,Father)  % 找到根结点
    for i=1:length(Node)
        while(Node(i)~=Father(Node(i)))
            Node(i) = Father(Node(i));
        end
    end
end
%% 并查集
% Father = MergeNode(Node1,Node2,Father)
% 输入:Node1:节点1
% Node2:节点2
% Father:父节点向量
% CompressOption:压缩选项,默认为压缩
% 输出:Father:新的父节点
function Father = MergeNode(Node1,Node2,Father,CompressOption)
if nargin == 3
CompressOption = 1;
end
RootNode1 = RootNode(Node1,Father);
if CompressOption % 采取压缩操作
while(Node1~=RootNode1) % 压缩Node1所在的集合
t = Father(Node1);
Father(Node1) = RootNode1;
Node1 = t;
end
while(Node2~=Father(Node2)) % 压缩Node2所在的集合
t = Father(Node2);
Father(Node2) = RootNode1; % 全部改变为Node1的根结点
Node2 = t;
end
Father(Node2) = RootNode1; % 改变根结点
else
Father(RootNode(Node2,Father)) = RootNode1; % 改变根结点
end
end主函数:
%% 用Kruskal算法求解最小生成树
function MST = Kruskal(Distance)
%% 开始计算
[Weight,Pos] = sort(Distance(find(triu(Distance)~=0)));
Num = max(find(~isinf(Weight)));
NumP = size(Distance);
Father = 1:NumP;
MST = [];
for i=1:Num
    [Node1,Node2] = GetSquarePos(Pos(i),NumP);
    if RootNode(Node1,Father) ~= RootNode(Node2,Father)
        Father = MergeNode(Node1,Node2,Father,0);
        MST = [MST;[Node1 Node2]];
        if size(MST,1) == NumP-1  % 如果树已满,就没有必要继续计算了
            break
        end
    end
end

%% 绘图
DrawMST(P,MST,0.08);
end
这里用到一个子函数GetSquarePos:
function [Node1,Node2] = GetSquarePos(pos,Dim)  % 输入向量中的位置,输出矩阵中的位置
    S = cumsum([0:Dim-1])-pos;
    Node1 = min(find(S>=0));         % 列数
    Node2 = pos-sum(0:Node1-2);      % 行数
end
该函数用于找到每条边对应的两个节点。
还有一个作图函数DrawMST:
%% 绘制最小生成树
function h = DrawMST(points,MST,deviation)  % MST:MinimumSpanningTree
if nargin == 2
    deviation = 0.01;
end
if size(points,2) >3
    error('本程序只能绘制二维或者三维图~~')
end
%% 开始作图
if size(points,2) == 2  % 二维数据
    for i=1:size(MST,1) % 树
        plot(points(MST(i,:),1),points(MST(i,:),2),'r-o','LineWidth',1.5,...
            'MarkerSize',5,'MarkerFaceColor','b'); hold on;
    end
    for i=1:size(points,1)
        text(points(i,1)+deviation,points(i,1),num2str(i));
    end
    title('最小生成树示意图')
    xlabel('x'), ylabel('y')
    h = gca;
else  % 三维数据
    for i=1:size(MST,1) % 树
        plot3(points(MST(i,:),1),points(MST(i,:),2),points(MST(i,:),3),'r-o','LineWidth',1.5,...
            'MarkerSize',5,'MarkerFaceColor','b'); hold on;
    end
    for i=1:size(points,1)
        text(points(i,1),points(i,2),points(i,3)+deviation,num2str(i),'color','g');
    end
    grid on;
    set(gca,'color','k')
    title('最小生成树示意图')
    xlabel('x'), ylabel('y'), zlabel('z')
    h = gca;
end
axis equal
end
该函数即可用于二维作图,也可用于三维。
输入参数:
P = [6.4889    5.5314    4.4938
    7.0347    5.7275    5.5554
    6.7269    7.0984    5.8441
    5.6966    5.7221    6.2761
    6.2939    6.7015    5.7388
    5.2127    3.9482    6.4434
    6.8884    5.6462    6.3919
    4.8529    5.1764    4.7493
    4.9311    4.4229    5.0520
    5.1905    6.5080    5.2589];
Distance = squareform(pdist(P));  % 不解释
运行结果:
ans =

     5     3
     9     8
     7     2
     7     4
     2     1
    10     5
     5     2
    10     8
     9     6
截图:
关于Prime的见另外一篇(上面的程序有些有些啰嗦,再接再励~)
版权声明:本文为博主原创文章,未经博主允许不得转载。
