pyecharts包绘制Map地图(笔记)
最近写文章,需要绘制地图,开始想用Tableau做,但是Tableau绘制某些地图不太方便,需要边界经纬度,于是找到了pyecharts
由于pyecharts版本更新,以前的代码不兼容新版本
pyecharts的中文官方文档(http://pyecharts.org/#/zh-cn/geography_charts)
通过作者给出的例子就可以快速上手,感谢作者!
pyecharts包安装
pip install -i https://pypi.tuna.tsinghua.edu.cn/simple pyecharts
下载地图包:
pip3 install echarts-countries-pypkg

pip3 install echarts-china-provinces-pypkg

pip3 install echarts-china-cities-pypkg
Map地图主要用于地理区域数据的可视化
geo地图主要用于热力分布图
#Map地图
#主要用于地理区域数据的可视化
#pyecharts包作者给出的func pyecharts.charts.Map.add

map.add(name, attr, value, maptype='china', is_roam=True, is_map_symbol_show=True, **kwargs)

def add(
    # 系列名称,用于 tooltip 的显示,legend 的图例筛选。
    series_name: str,

    # 数据项 (坐标点名称,坐标点值)
    data_pair: Sequence,

    # 地图类型,具体参考 pyecharts.datasets.map_filenames.json 文件
    maptype: str = "china",

    # 是否选中图例
    is_selected: bool = True,

    # 是否开启鼠标缩放和平移漫游。
    is_roam: bool = True,

    # 当前视角的中心点,用经纬度表示
    center: Optional[Sequence] = None,

    # 当前视角的缩放比例。
    zoom: Optional[Numeric] = 1,

    # 自定义地区的名称映射
    name_map: Optional[dict] = None,

    # 标记图形形状
    symbol: Optional[str] = None,

    # 是否显示标记图形
    is_map_symbol_show: bool = True,

    # 标签配置项,参考 `series_options.LabelOpts`
    label_opts: Union[opts.LabelOpts, dict] = opts.LabelOpts(),

    # 提示框组件配置项,参考 `series_options.TooltipOpts`
    tooltip_opts: Union[opts.TooltipOpts, dict, None] = None,

    # 图元样式配置项,参考 `series_options.ItemStyleOpts`
    itemstyle_opts: Union[opts.ItemStyleOpts, dict, None] = None,

    # 高亮标签配置项,参考 `series_options.LabelOpts`
    emphasis_label_opts: Union[opts.LabelOpts, dict, None] = None,

    # 高亮图元样式配置项,参考 `series_options.ItemStyleOpts`
    emphasis_itemstyle_opts: Union[opts.ItemStyleOpts, dict, None] = None,
)
#新版本的导包方式发生了变化
from pyecharts import options as opts
from pyecharts.charts import Map
from pyecharts.faker import Faker

#Map:地图
#准备数据
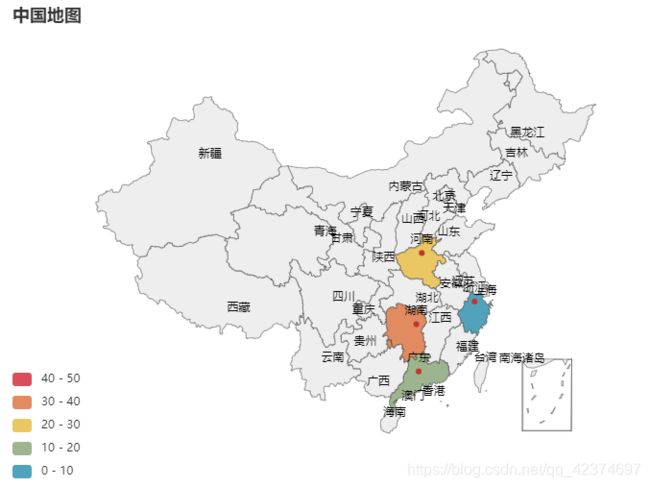
data = [('浙江', 10),('广东', 20),('河南', 30),('湖南', 40)]

def map_china():
    c = (
        Map()
        .add(series_name="", data_pair=data, maptype="china")
        # 使用 options 配置项,在 pyecharts 中,一切皆 Options
        .set_global_opts(
            title_opts=opts.TitleOpts(title="中国地图"),
            visualmap_opts=opts.VisualMapOpts(max_=50,is_piecewise=True,#最大数据范围以及是否分段
        )
    ))

    return c
if __name__ == '__main__':
    d_map = map_china()
    d_map.render(path="C:/test_map_1.html")
from pyecharts import options as opts
from pyecharts.charts import Map
from pyecharts.faker import Faker

c = (
    Map()
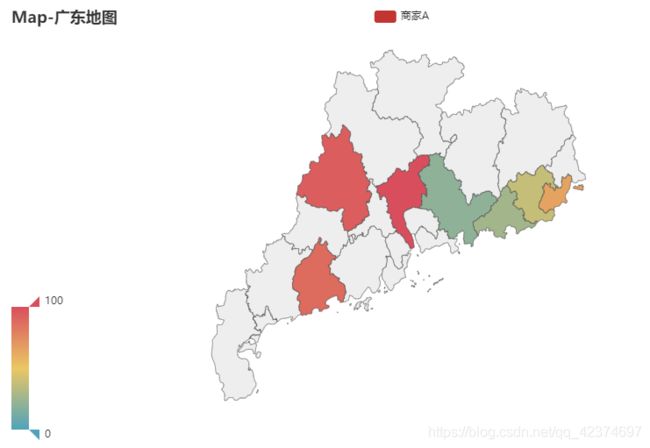
    .add("商家A", [list(z) for z in zip(Faker.guangdong_city, Faker.values())], "广东")
    .set_global_opts(
        title_opts=opts.TitleOpts(title="Map-广东地图"), visualmap_opts=opts.VisualMapOpts()
    )
    .render("C:/map_guangdong.html")
)
from pyecharts import options as opts
from pyecharts.charts import Map
from pyecharts.faker import Faker

c = (
    Map()
    .add("商家A", [list(z) for z in zip(Faker.guangdong_city, Faker.values())], "广东",is_map_symbol_show=False,) #不显示标记图形
    .set_series_opts(label_opts=opts.LabelOpts(is_show=False)) #不显示标签(城市名)
    .set_global_opts(
        title_opts=opts.TitleOpts(title="Map-广东地图"), visualmap_opts=opts.VisualMapOpts()
    )
    .render("C:/map_guangdong.html")
)
from pyecharts import options as opts
from pyecharts.charts import Map
from pyecharts.faker import Faker

cq_city = ["北碚区", "巴南区", "渝北区", "九龙坡区","渝中区","江北区","南岸区","沙坪坝区","大渡口区"]
GDP_value = [552, 781, 1543, 1211,1204,1028,725,936,228]

def map_cq():
    c = (
        Map()
        .add("", [list(z) for z in zip(cq_city, GDP_value)], "重庆",is_map_symbol_show=False,)
        .set_series_opts(label_opts=opts.LabelOpts(is_show=False))

        .set_global_opts(
            title_opts=opts.TitleOpts(title="2018年重庆主城九区"),
            visualmap_opts=opts.VisualMapOpts(max_=99999,is_piecewise=True,
                            pieces=[{"max": 499, "min": 0, "label": "0-499","color":"#FFE4E1"},
                                    {"max": 899, "min": 500, "label": "500-899","color":"#FF7F50"},
                                    {"max": 1299, "min": 900, "label": "900-1299","color":"#F08080"},
                                    {"max": 1599, "min": 1300, "label": ">=1300","color":"#CD5C5C"}])
        )
    )
    return c
if __name__ == '__main__':
    cq = map_cq()
    cq.render(path="C:/test_map_1.html")
from pyecharts import options as opts
from pyecharts.charts import Map
from pyecharts.faker import Faker

cq_city = ["北碚区", "巴南区", "渝北区", "九龙坡区","渝中区","江北区","南岸区","沙坪坝区","大渡口区"]
GDP_value = [552, 781, 1543, 1211,1204,1028,725,936,228]

def map_cq():
    c = (
        Map()
        .add("", [list(z) for z in zip(cq_city, GDP_value)], "重庆",is_map_symbol_show=False,)
        .set_series_opts(label_opts=opts.LabelOpts(is_show=False))

        .set_global_opts(
            title_opts=opts.TitleOpts(title="2018年重庆主城九区GDP(亿元)"),
            visualmap_opts=opts.VisualMapOpts(max_=1550,is_piecewise=True,)
        )
    )
    return c
if __name__ == '__main__':
    cq = map_cq()
    cq.render(path="C:/test_map_1.html")
from pyecharts import options as opts
from pyecharts.charts import Map
from pyecharts.faker import Faker

cq_city = ["北碚区", "巴南区", "渝北区", "九龙坡区","渝中区","江北区","南岸区","沙坪坝区","大渡口区"]
GDP_value = [552, 781, 1543, 1211,1204,1028,725,936,228]

def map_cq():
    c = (
        Map()
        .add("", [list(z) for z in zip(cq_city, GDP_value)], "重庆",is_map_symbol_show=False,)
        .set_series_opts(label_opts=opts.LabelOpts(is_show=False))

        .set_global_opts(
            title_opts=opts.TitleOpts(title="2018年重庆主城九区GDP(亿元)"),
            visualmap_opts=opts.VisualMapOpts(max_=1600,split_number=8, is_piecewise=True,) #split_number 表示图例所分的段数
        )
    )
    return c
if __name__ == '__main__':
    cq = map_cq()
    cq.render(path="C:/test_map_1.html")
from pyecharts import options as opts
from pyecharts.charts import Map
from pyecharts.faker import Faker

country = ["China", "Canada", "Brazil", "Russia", "United States", "Africa", "Germany"]
value = [300, 100, 2000, 800, 10000, 400, 5000]

def map_world():
    c = (
        Map()
        .add("", [list(z) for z in zip(country, value)], "world",is_map_symbol_show=False,)
        .set_series_opts(label_opts=opts.LabelOpts(is_show=False))

        .set_global_opts(
            title_opts=opts.TitleOpts(title="世界地图"),
            visualmap_opts=opts.VisualMapOpts(max_=2000,)
        )
    )
    return c
if __name__ == '__main__':
    result = map_world()
    result.render(path="C:/test_map_1.html")


