Echarts笔记
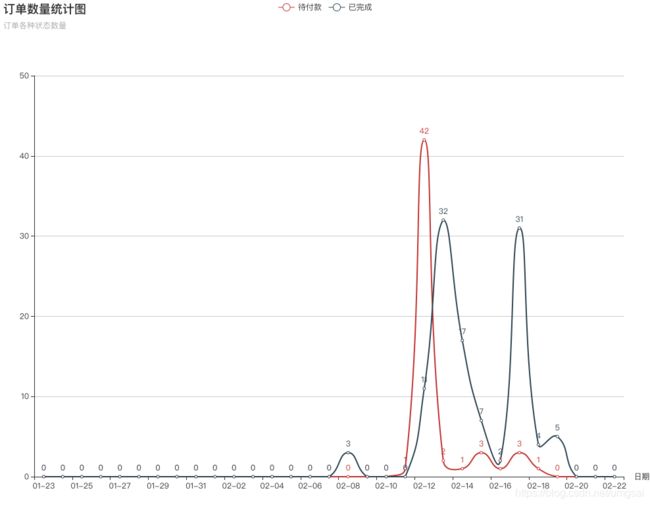
1.平滑曲线图
var colors = ['#5793f3', '#d14a61', '#675bba'];


option = {
    "title":{
        "text":"订单数量统计图",
        "subtext":"订单各种状态数量"
    },
    "tooltip":{
        "trigger":"axis",
        "axisPointer":{
            "type":"cross",
            "label":{
                "backgroundColor":"#6a7985"
            }
        }
    },
    "legend":{
        "left":"center",
        "data":[
            "待付款",
            "已完成"
        ]
    },
    "xAxis":{
        "type":"category",
        "name":"日期",
        "splitLine":{
            "show":false
        },
        "data":[
            "01-23",
            "01-24",
            "01-25",
            "01-26",
            "01-27",
            "01-28",
            "01-29",
            "01-30",
            "01-31",
            "02-01",
            "02-02",
            "02-03",
            "02-04",
            "02-05",
            "02-06",
            "02-07",
            "02-08",
            "02-09",
            "02-10",
            "02-11",
            "02-12",
            "02-13",
            "02-14",
            "02-15",
            "02-16",
            "02-17",
            "02-18",
            "02-19",
            "02-20",
            "02-21",
            "02-22"
        ]
    },
    "grid":{
        "top":"15%",
        "left":"3%",
        "right":"4%",
        "bottom":"3%",
        "containLabel":true
    },
    toolbox: {
            show: true,
            orient: 'vertical',
            left: 'right',
            top: 'center',
            feature: {
                mark: {show: true},
                dataView: {show: true, readOnly: false},
                magicType: {show: true, type: ['line', 'bar', 'stack', 'tiled']},
                restore: {show: true},
                saveAsImage: {show: true}
            }
        },
    yAxis: [
        {
            type: 'value'
        }
    ],
    "series":[
        {
            "name":"待付款",
            "type":"line",
            "smooth":true,
            "label":{
                "normal":{
                    "show":true,
                    "position":"top"
                }
            },
            "data":[
                "0",
                "0",
                "0",
                "0",
                "0",
                "0",
                "0",
                "0",
                "0",
                "0",
                "0",
                "0",
                "0",
                "0",
                "0",
                "0",
                "0",
                "0",
                "0",
                "1",
                "42",
                "2",
                "1",
                "3",
                "1",
                "3",
                "1",
                "0",
                "0",
                "0",
                "0"
            ]
        },
        {
            "name":"已完成",
            "type":"line",
            "smooth":true,
            "label":{
                "normal":{
                    "show":true,
                    "position":"top"
                }
            },
            "data":[
                "0",
                "0",
                "0",
                "0",
                "0",
                "0",
                "0",
                "0",
                "0",
                "0",
                "0",
                "0",
                "0",
                "0",
                "0",
                "0",
                "3",
                "0",
                "0",
                "0",
                "11",
                "32",
                "17",
                "7",
                "2",
                "31",
                "4",
                "5",
                "0",
                "0",
                "0"
            ]
        }
    ]
};
