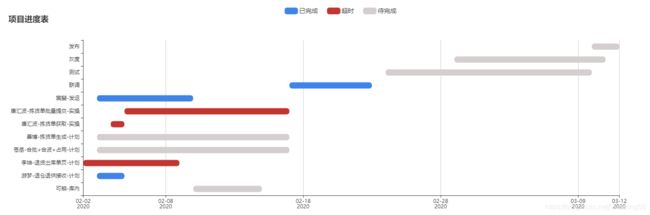
echarts + vue 实现项目进度不同颜色柱形甘特图
template 里代码
已完成超时待完成
script代码
import echarts from 'echarts' // 注意echarts版本,高版本不支持透明度rgba,以下代码版本为3.8.5
export default {
    name: 'project-progress',
    data () {
        return {
            ganttChart: null,
            chartData: [
                {
                    name: '可熊-库内',
                    start: '2020-02-10',
                    end: '2020-02-15',
                    status: 1 // 1 待完成 2 已完成 3 超时
                },
                {
                    name: '游梦-退仓退供接收-计划',
                    start: '2020-02-03',
                    end: '2020-02-05',
                    status: 2
                },
                {
                    name: '李坤-退货出库单页-计划',
                    start: '2020-02-02',
                    end: '2020-02-09',
                    status: 3
                },
                {
                    name: '苍岳-合批+合波+占用-计划',
                    start: '2020-02-03',
                    end: '2020-02-17',
                    status: 1
                },
                {
                    name: '善博-拣货单生成-计划',
                    start: '2020-02-03',
                    end: '2020-02-17',
                    status: 1
                },
                {
                    name: '唐汇波-拣货单获取-实操',
                    start: '2020-02-04',
                    end: '2020-02-05',
                    status: 3
                },
                {
                    name: '唐汇波-拣货单批量提交-实操',
                    start: '2020-02-05',
                    end: '2020-02-17',
                    status: 3
                },
                {
                    name: '宸斐-发运',
                    start: '2020-02-03',
                    end: '2020-02-10',
                    status: 2
                },
                {
                    name: '联调',
                    start: '2020-02-17',
                    end: '2020-02-23',
                    status: 2
                },
                {
                    name: '测试',
                    start: '2020-02-24',
                    end: '2020-03-10',
                    status: 1
                },
                {
                    name: '灰度',
                    start: '2020-02-29',
                    end: '2020-03-11',
                    status: 1
                },
                {
                    name: '发布',
                    start: '2020-03-10',
                    end: '2020-03-12',
                    status: 1
                }
            ]
        }
    },
    mounted () {
        window.addEventListener(
            'resize',
            window._.debounce(() => {
                this.resizeCharts()
            }, 100)
        )
        this.$nextTick(() => {
            this.initChart()
        })
    },
    methods: {
        initChart () {
            this.ganttChart = echarts.init(document.getElementById('gantt-chart'))
            const _self = this
            const chartOption = {
                title: {
                    text: '项目进度表',
                    left: 10
                },
                grid: {
                    containLabel: true,
                    left: 20
                },
                xAxis: {
                    type: 'time'
                },
                yAxis: {
                    data: this.chartData.map(item => item.name)
                },
                tooltip: {
                    trigger: 'axis',
                    formatter: function (params) {
                        // var res = params[0].name + ''
                        var res = '节点周期:' + ''
                        var date0 = params[0].data
                        var date1 = params[1].data
                        // date0 = date0.getFullYear() + '-' + (date0.getMonth() + 1) + '-' + date0.getDate()
                        // date1 = date1.getFullYear() + '-' + (date1.getMonth() + 1) + '-' + date1.getDate()
                        res += date0 + '-' + date1 + ''
                        // console.log(params[0])
                        return res
                    }
                },
                series: [
                    {
                        name: '实际开始时间',
                        type: 'bar',
                        stack: 'timeout',
                        itemStyle: {
                            normal: {
                                color: 'rgba(0,0,0,0)'
                            }
                        },
                        lineStyle: {},
                        data: this.chartData.map(item => item.start)
                    },
                    {
                        name: '超时',
                        type: 'bar',
                        stack: 'timeout',
                        barWidth: 14, // 柱宽度
                        itemStyle: {
                            normal: {
                                barBorderRadius: 25, // 柱圆角
                                color: function (params) {
                                    let color = ''
                                    // var colorList = ['#3E84E9','#c23531','#d4cece']; // 超时, 已完成, 待完成
                                    var item = _self.chartData.filter(item => { return item.name === params.name })
                                    var status = item && item[0] && item[0].status
                                    // console.log('====', status)
                                    color = status === 1 ? '#d4cece' : (status === 2 ? '#3E84E9' : '#c23531')
                                    return color
                                }
                            }
                        },
                        data: this.chartData.map(item => item.end)
                    }
                ]
            }
            this.ganttChart.setOption(chartOption) // 第二个参数:true: 是否和之前设置的option进行合并,true为不合并,默认为false:合并
            this.resizeCharts()
        },
        resizeCharts () {
            this.ganttChart && this.ganttChart.resize()
        },
    destroyed () {
        window.removeEventListener('resize', this.resizeCharts) // 销毁事件
    }
}
样式代码