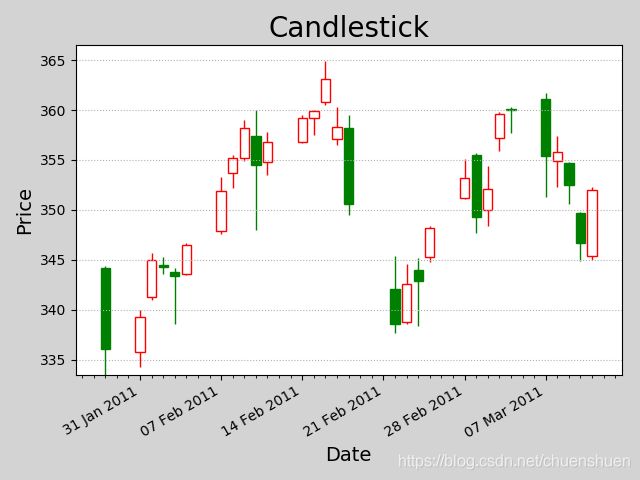
Numpy实战: numpy + matplotlib绘制K线图
这篇文章,我们讲一次numpy与matplotlib的实操,绘制一支股票的K线图
在数据获得的过程中,我们往往不能直接获取到我们想要的数据格式,需要对其进行处理。
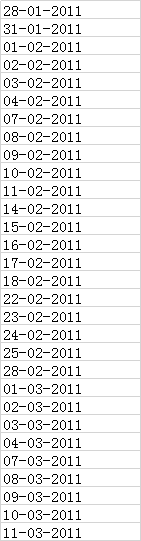
 这是我们获取到的日期,我们需要将其转换为我们需要的年-月-日形式
# 将日-月-年格式的日期变为年-月-日格式的转换器函数
def dmyToymd(dmy):
    # 将UTF-8编码的字节串转换为UCS-4编码字符串
    dmy = str(dmy, encoding='utf-8')
    # 将日-月-年格式的日期字符串解析为datetime类型的对象,再取其date类型的日期子对象
    date = dt.datetime.strptime(dmy, '%d-%m-%Y').date()
    # 将date类型的日期对象格式化为年-月-日形式的字符串
    ymd = date.strftime('%Y-%m-%d')
    return ymd
我们先定义一个这样的转换函数
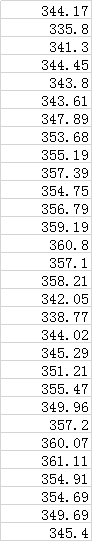
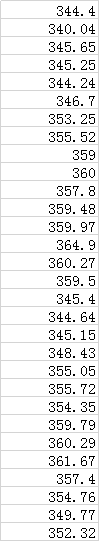
 是我们接下来读取的5组数据
# -*- coding: utf-8 -*-
from __future__ import unicode_literals
import datetime as dt
import numpy as np
import matplotlib.pyplot as plt
import matplotlib.dates as md


# 将日-月-年格式的日期变为年-月-日格式的转换器函数
def dmyToymd(dmy):
        # 将UTF-8编码的字节串转换为UCS-4编码字符串
    dmy = str(dmy, encoding='utf-8')
    # 将日-月-年格式的日期字符串解析为datetime类型的对象,再取其date类型的日期子对象
    date = dt.datetime.strptime(dmy, '%d-%m-%Y').date()
    # 将date类型的日期对象格式
    # 化为年-月-日形式的字符串
    ymd = date.strftime('%Y-%m-%d')
    return ymd


# 从aapl.csv文件中读取苹果公司一段时间内的 股票价格:开盘价,最高价,最低价和收盘价
dates, opening_prices, highest_prices, \
    lowest_prices, closing_prices = np.loadtxt(
        './aapl.csv', delimiter=",",
        usecols=(1, 3, 4, 5, 6), unpack=True,
        dtype='M8[D], f8, f8, f8, f8',
        converters={1: dmyToymd})

#创建figure对象
plt.figure('Candlestick', facecolor='lightgray')
plt.title('Candlestick', fontsize=20)
plt.xlabel('Date', fontsize=14)
plt.ylabel('Price', fontsize=14)
#获取坐标轴对象
ax = plt.gca()

# 主刻度表示每个星期的星期一
ax.xaxis.set_major_locator(md.WeekdayLocator(byweekday=md.MO))

# 次刻度表示每一天
ax.xaxis.set_minor_locator(md.DayLocator())

# 设置主刻度的标签格式:日 月(英文缩写) 年
ax.xaxis.set_major_formatter(md.DateFormatter('%d %b %Y'))

plt.tick_params(labelsize=10)
plt.grid(axis='y', linestyle=':')
# Numpy.datetime64[D]  转换为  Matplotlib.dates.datetime.datetime
dates = dates.astype(md.datetime.datetime)

#使用布尔值进行掩码,大于0.01为True,小于0.01为False
rise = closing_prices - opening_prices >= 0.01
fall = opening_prices - closing_prices >= 0.01

fc = np.zeros(dates.size, dtype='3f4')
ec = np.zeros(dates.size, dtype='3f4')

fc[rise], fc[fall] = (1, 1, 1), (0, 0.5, 0)          #颜色调整
ec[rise], ec[fall] = (1, 0, 0), (0, 0.5, 0)

plt.bar(dates, highest_prices - lowest_prices,0, lowest_prices, color=fc, edgecolor=ec)
plt.bar(dates, closing_prices - opening_prices,
       0.8, opening_prices, color=fc, edgecolor=ec)

plt.gcf().autofmt_xdate()

plt.show()