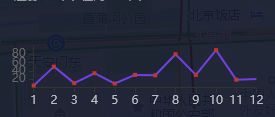
Echarts折线图
js:
var myChart = echarts.init(document.getElementById('fold_line'));
option = {
	title: {
		text: '',
		subtext: '危险行为次数:10次',
//      left: 'right',
        top:'-13px',
        right:'4%',
        color:'#fff'
	},
	tooltip: {
		trigger: 'axis'
	},

	grid: {
		left: '2%',
		right: '8%',
		bottom: '3%',
		containLabel: true
	},
	toolbox: {

	},
	xAxis: {
		splitLine: {
			show: false
		}, //去除网格线
		type: 'category',
		boundaryGap: false,
		axisLabel: {
			show: true,
			textStyle: {
				color: 'rgba(255,255,255,0.7)'
			}
		},
		data: ['1', '2', '3', '4', '5', '6', '7', '8', '9', '10', '11', '12']
	},
	yAxis: {
		type: 'value',
		axisLabel: {
			formatter: '{value}',
			textStyle: {
				color: '#666'
			}
		},
		splitLine: {
			show: false
		}, //去除网格线
	},
	series: [{
		symbol: 'rectangle',
		name: '危险行为次数',
		type: 'line',
		stack: '总量',
		itemStyle: {
			normal: {
				lineStyle: {
					width: 2, //折线宽度
					color: "#7040E0" //折线颜色
				}
			}
		},
		data: [4, 50, 10, 34, 9, 30, 29, 80, 30, 90, 18, 20]
	}]
};

// 使用刚指定的配置项和数据显示图表。
myChart.setOption(option);
window.onresize = myChart.resize;
