MATPLOTLIB官网examples练习及笔记
MATPLOTLIB官网地址:https://matplotlib.org/gallery/lines_bars_and_markers/simple_plot.html
eg1:正弦波
需要用到的知识点:
matplotlib.axes.Axes.plot
matplotlib.pyplot.plot
matplotlib.pyplot.subplots
matplotlib.figure.Figure.savefig
import matplotlib
import matplotlib.pyplot as plt
import numpy as np

t = np.arange(0.0, 2.0, 0.01)#设置t的值
s = 1 + np.sin(2 * np.pi * t)#设置s的值

fig, ax = plt.subplots()#只创建一个图形和一个子图
ax.plot(t, s)#子图上面的数据为t,s
ax.set(xlabel='time(s)', ylabel='voltage(mV)', title='About as simple s it gets, folks')
#设置子图的x轴名标注为time(S),y轴名标注为voltage(mV),整个图形的名称为About as simple s it gets, folks

ax.grid()#设置网格

fig.savefig("test.png")#保存图片为png格式
plt.show()#显示图形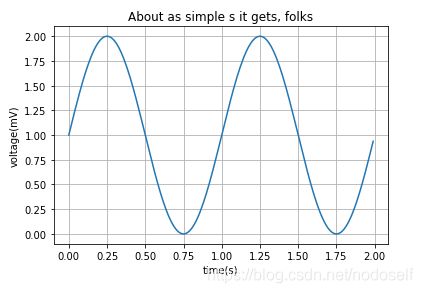
eg2:A tale of 2 subplots
import matplotlib.pyplot as plt
import numpy as np


x1 = np.linspace(0.0, 5.0)#创建x1为等差数列的值
x2 = np.linspace(0.0, 2.0)#创建x2为等差数列的值

y1 = np.cos(2 * np.pi * x1) * np.exp(-x1)#创建y1的值
y2 = np.cos(2 * np.pi * x2)#创建y2的值

plt.subplot(2, 1, 1)#设置2个子图,该子图的位置在上面
plt.plot(x1, y1, 'o-')#以x1,y1为数据,创建图形,图形为实线且用实心圈标记
plt.title('A tale of 2 subplots')#整个图形的标题为A tale of 2 subplots
plt.ylabel('Damped oscillation')#此图形的y轴标注为Damped oscillation

plt.subplot(2, 1, 2)#设置2个子图,该子图的位置在下面
plt.plot(x2, y2, '.-')#以x2,y2为数据,创建图形,图形为实线且用像素标记(极小点)
plt.xlabel('time(s)')#设置x轴的标注为time(s)
plt.ylabel('Undamped')#设置此图形的y轴标注为Undamped

plt.show()#显示图形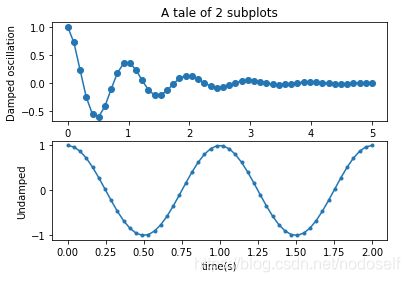
eg3:
需要用到的知识点:
matplotlib.pyplot.imshow(X, cmap=None, norm=None, aspect=None, interpolation=None, alpha=None, vmin=None, vmax=None, origin=None, extent=None, shape=None, filternorm=1, filterrad=4.0, imlim=None, resample=None, url=None, *, data=None, **kwargs)
此函数的详细用法可至官网查看:https://matplotlib.org/api/_as_gen/matplotlib.pyplot.imshow.html#matplotlib.pyplot.imshow
import matplotlib.cm as cm
import matplotlib.pyplot as plt
import numpy as np
import matplotlib.cbook as cbook
from matplotlib.path import Path
from matplotlib.patches import PathPatch


delta = 0.025
x = y = np.arange(-3.0, 3.0, delta)#设置x,y的值
X, Y = np.meshgrid(x, y)#快速生成网格坐标矩阵
Z1 = np.exp(-X**2 - Y**2)#赋值Z1为自然常数e的-X**2 - Y**2次方
Z2 = np.exp(-(X - 1)**2 - (Y - 1)**2)#赋值Z2为自然常数e的-(X - 1)**2 - (Y - 1)**2次方
Z = (Z1 - Z2) * 2#赋值Z的值

fig, ax = plt.subplots()#创建1个图形和1个子图
im = ax.imshow(Z, interpolation='bilinear', cmap=cm.RdYlGn, origin='lower', extent=[-3, 3, -3, 3],
              vmax=abs(Z).max(), vmin=-abs(Z).max())

plt.show()
eg4:
A = np.random.rand(5, 5)

fig, axs = plt.subplots(1, 3, figsize=(10, 3))
for ax, interp in zip(axs, ['nearest', 'bilinear', 'bicubic']):
    ax.imshow(A, interpolation=interp)
    ax.set_title(interp.capitalize())
    ax.grid(True)

plt.show()