小白学习图像处理7——Hough变换检测直线
文章目录
- 一、Hough变换的原理
- 1、过定点的直线方程
- 2、两点确定一条直线
- 3、方程的形式
- 二、实现过程
- 三、程序代码
- 1、程序片段
- 2、总程序
- 四、matlab 的hough函数
一、Hough变换的原理
1、过定点的直线方程
在 xoy 平面给定一个点P(xi, yi),则过点P的一条直线可以用表示为(直线x = C 除外):
y i = a x i + b y_{i} = ax_{i}+b yi=axi+b
过点P的直线有无数条,它们构成一个集和,参数a、b满足方程:
b = − a x i + y i b = - ax_{i} + y_{i} b=−axi+yi
也就是说,参数a、b在一条直线上,直线斜率为-xi,截距为yi。把a、b构成的平面称为参数空间,因此:xoy平面内的一点确定参数空间的一条直线,下图展示了对应关系:,对应关系如下图所示:

2、两点确定一条直线
如下图,若给定 xoy 平面内的两个点 P(x1, y1) 和 Q(x2, y2),则在参数空间内我们可以确定两条直线,这两条直线交于一点 (a0, b0),参数空间内点(a0, b0)对应着过两点的直线。
参数空间内的一条直线对应着 xoy 平面的一个点,参数空间的一个点对应着 xoy 平面的一条直线。

3、方程的形式
上面的结果说明了,我们可以在参数空间找直线的交点,反过来确定 xoy 平面的直线。前面的直线方程表达式为斜截式,斜截式存在一个问题,当直线的斜率很大的时候,截距趋于无穷,因此需要考虑别的形式。
使用直线的 法线斜率 来表示直线可以巧妙地避开参数无穷大的问题(注意这个表达式不是极坐标表示):
x c o s θ + y s i n θ = ρ x cos\theta + y sin\theta = \rho xcosθ+ysinθ=ρ
其中,参数 ρ 表示原点到直线的距离,ρ∈[-D, D],D 为图像的对角线长度,参数θ表示直线的法线与x轴的夹角,θ∈[-pi/4, pi/4]。对上式变一下形可得:
y = − x c o t θ + ρ / s i n θ y = - x cot \theta + \rho / sin \theta y=−xcotθ+ρ/sinθ
这个式子和斜截式一模一样,下图说明了它的几何意义:

解释:其中,对于点 (xi, yi) 来说,OB 表示ρ,0A代表 xi cosθ,AB表示 yi sin θ,于是xi cosθ + yi sinθ = ρ,由于点 (xi, yi) 是任意的,因此直线上每一点豆豆满足该方程(有没有觉得很直观)
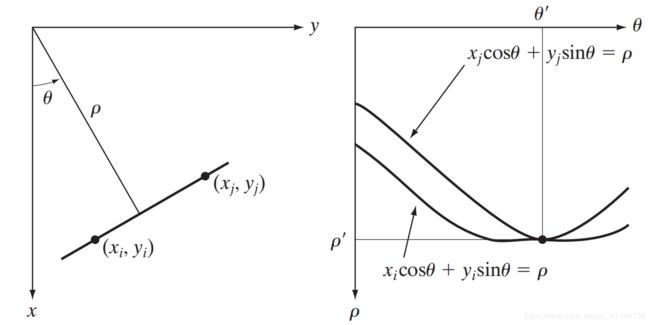
xoy 平面内的任意一个点都对应了一个方程,每一个方程确定了参数空间的一条 正弦波,若已知两个定点(xi, yi),(xj, yi),则在参数空间内对应的正弦波交于一点,该点确定了过两点的直线,如图:
二、实现过程
上一部分给出了hough变换的理论基础,要在图像中检测直线还需要一定的处理。一幅图像对应着一系列的离散点,映射到参数平面一系列(ρ, θ)的组合,首先将ρθ参数空间划分为 累加单元,xy平面内一个点对于的参数空间的每一条曲线离散化为点,落在累加单元内,如下图所示:
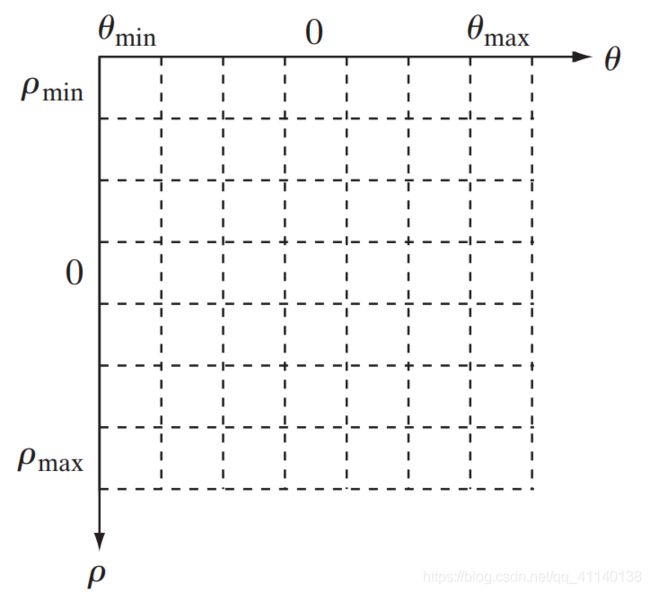
坐标(i, j)处的单元具有累加值 A(i, j),它对应于参数空间坐标(ρi, θj)相关联的正方形(我们对参数空间离散化为无数个正方形)
具体的步骤:
- 离散化ρθ参数空间,得到累加单元 A。
- 最初将所有累加单元的值A(i, j)置为零。
- 然后对于xoy平面内的每一个非背景点(xk, yk),令 θ 等于 θ 轴上每一个允许的离散值,使用参数方程计算出 ρ 的对应值。对得到的 ρ 值四舍五入,得到最邻近的ρ轴上的离散值。对每一个非背景点,一个 θp 对于着 ρq ,则令A(p, q)加一。
- 完成上述步骤后,A(i, j)的值对应着xoy平面内有多少个点位于由参数(θ, ρ)确定的直线上。
三、程序代码
1、程序片段
提取边缘
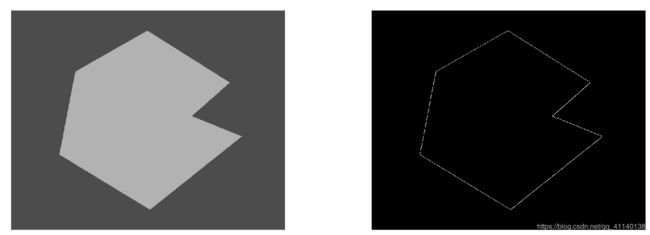
为了检测直线,首先要提取图像的边缘,可以使用edge 函数提取图像边缘,假设读入的图像为灰度图:
img = imread(file_name);
img = im2double(img);
Edge = edge(img, 'canny', 0.2, 0.5, 1);
figure
subplot(121), imshow(img)
subplot(122), imshow(Edge)
set(gcf, 'color', [1 1 1])
参数平面离散化
构建一个ρθ平面,并离散化为一个个方格,每一个小方格代表一个计数器,将计数器的值初始化为0,每个计数器对应的ρ-θ值确定了x-y平面内的一条直线(注意计数器的坐标与计数器对应的ρ-θ值的关系):
[h, w] = size(Edge);
D = ceil(sqrt((h*h + w*w)));    % 对角线
d_rho = 2*D/precision;    % 单元大小
d_theta = pi/precision;    % 单元大小
rho = -D : d_rho : D;
theta = -pi/2 : d_theta : pi/2;

counter = zeros(length(rho), length(theta));  % ρ-θ平面计数器
累加器单元计数
遍历图像的每一个像素点,如果该像素点上的灰度为1(edge函数得到一个二值图像,灰度为1说明像素点为非背景点),则通过点的坐标 (x, y) 得到 ρ-θ 平面内的一条直线,将 ρ-θ 内满足该直线方程的计数器的值加一:
rho_val = @(x, y, theta) x*cos(theta) + y*sin(theta);

for x = 1 : h
    for y = 1 : w
        if Edge(x, y) == 1
            for theta_i = -pi/2 : d_theta : pi/2
                rho_i = rho_val(x, y, theta_i);
                rho_pos = round((rho_i + D) / d_rho + 1);             % 累加单元纵坐标
                theta_pos = round((theta_i + pi/2) / d_theta + 1);   % 累加单元横坐标
                counter(rho_pos, theta_pos) = counter(rho_pos, theta_pos) + 1;
            end
        end
    end
end
检测直线
通过上面的计数过程,我们将 ρ-θ 平面当作图像绘制出来:
counter = counter / max(max(counter));    % 归一化
figure, imshow(counter)
set(gcf, 'color', [1 1 1])
结果如下,它是由很多条正弦曲线叠加得到的,多条曲线的交点就是直线的位置:

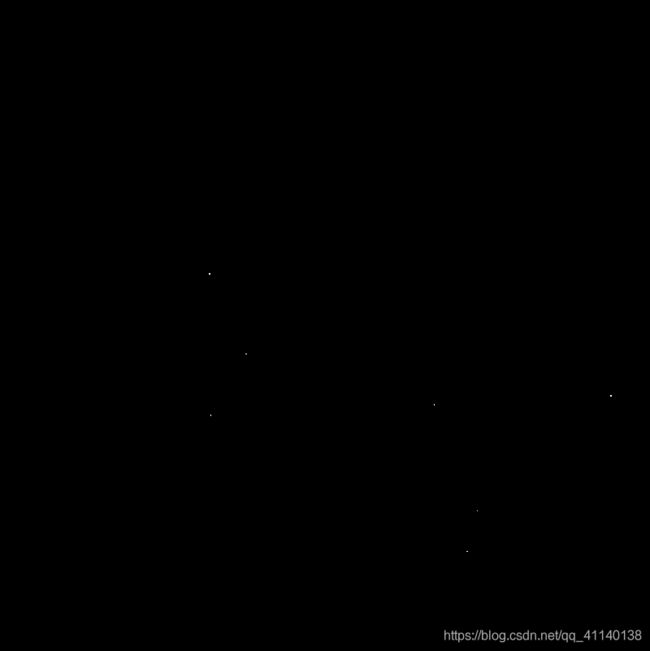
下面我们把最亮的那几个点提取出来:
counter = counter.*im2bw(counter, threshold);    % 将较暗的点置为0
% 亮的区域,只保留局部最大值
counter = counter.*(counter == ordfilt2(counter, domian_size.^2, ones(domian_size)));
counter = im2bw(counter, 0);
figure, imshow(counter)
set(gcf, 'color', [1 1 1])
% 计算所有直线的参数
[rho_pos, theta_pos] = find(counter > 0);
theta_set = (theta_pos * d_theta - pi/2);   % theta 集合
rho_set = rho_pos * d_rho - D;                  % rho 集合
绘制直线
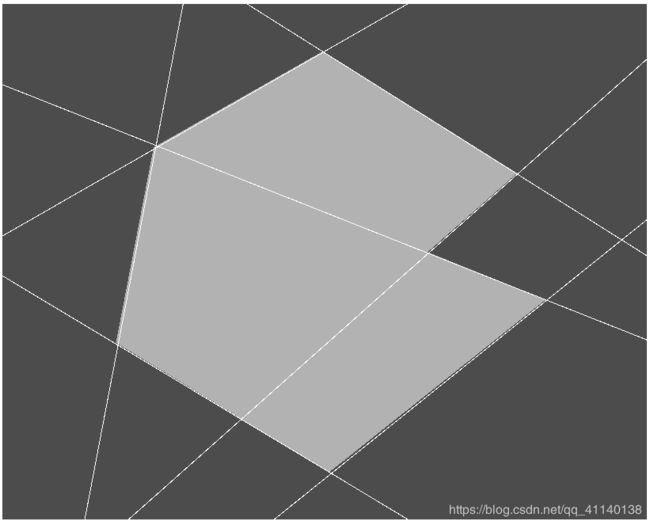
思路:遍历x-y平面内的所有像素点,如果x-y平面内的像素点(x0, y0) 坐标满足任意一对参数所确定的直线方程,则将原图像中的 (x0, y0) 像素点的灰度置为1:
%% 绘制边
for x = 1 : h
    for y = 1 : w
        % 判断点属于某条直线(满足某个直线方程)
        isLine = find(round(x*cos(theta_set) + y*sin(theta_set) - rho_set) == 0);
        if ~isempty(isLine)
            img(x, y) = 1;
        end
    end
end
figure, imshow(img)
set(gcf, 'color', [1 1 1])
2、总程序
在程序的开始我们设定了三个参数,参数precision确定要把参数空间划分为多少格;参数threshold用于抑制参数平面内“较暗”的点;参数domian_size用于提取参数空间的局部最大值,确定直线。
close all

%% 参数
precision = 900;    % 控制精度,越大精度越高
threshold = 0.3;    % 控制可被检测的最小直线长度,越小可被检测到的线段越短
domian_size = 30;   % 避免重复的直线,适当大一些比较好
file_name = 'septagon.tif';

%% 提取边缘
img = imread(file_name);
img = im2double(img);
Edge = edge(img, 'canny', 0.2, 0.5, 1);
figure
subplot(121), imshow(img)
subplot(122), imshow(Edge)
set(gcf, 'color', [1 1 1])

%% 参数空间离散化
[h, w] = size(Edge);
D = ceil(sqrt((h*h + w*w)));    % 对角线
d_rho = 2*D/precision;    % 单元大小
d_theta = pi/precision;    % 单元大小
rho = -D : d_rho : D;
theta = -pi/2 : d_theta : pi/2;

counter = zeros(length(rho), length(theta));  % ρ-θ平面

%% 计数
rho_val = @(x, y, theta) x*cos(theta) + y*sin(theta);

for x = 1 : h
    for y = 1 : w
        if Edge(x, y) == 1
            for theta_i = -pi/2 : d_theta : pi/2
                rho_i = rho_val(x, y, theta_i);
                rho_pos = round((rho_i + D) / d_rho + 1);             % 累加单元纵坐标
                theta_pos = round((theta_i + pi/2) / d_theta + 1);   % 累加单元横坐标
                counter(rho_pos, theta_pos) = counter(rho_pos, theta_pos) + 1;
            end
        end
    end
end

%% 检测边
counter = counter / max(max(counter));    % 归一化
figure, imshow(counter)
set(gcf, 'color', [1 1 1])

% 获得计数器值很大的边,抑制位置几乎相同的参数
counter = counter.*im2bw(counter, threshold);    % 只保留计数器值大的计数器
counter = counter.*(counter == ordfilt2(counter, domian_size.^2, ones(domian_size)));    % 抑制位置相近的参数
counter = im2bw(counter, 0);
figure, imshow(counter)
set(gcf, 'color', [1 1 1])

% 计算所有直线的参数
[rho_pos, theta_pos] = find(counter > 0);
theta_set = (theta_pos * d_theta - pi/2);   % theta 集合
rho_set = rho_pos * d_rho - D;                  % rho 集合

%% 绘制边
for x = 1 : h
    for y = 1 : w
        % 判断点属于某条直线(满足某个直线方程)
        isLine = find(round(x*cos(theta_set) + y*sin(theta_set) - rho_set) == 0);
        if ~isempty(isLine)
            img(x, y) = 1;
        end
    end
end
figure, imshow(img)
set(gcf, 'color', [1 1 1])
四、matlab 的hough函数
参考:小白学习图像处理——使用matlab的hough变换函数
完结~
