python scipy.singal包设计陷波滤波器,峰值滤波器
最近在做脑电信号处理,需要用到50Hz陷波滤波器滤掉工频干扰,在网上找了点资料,使用scipy.singal包可以做到。再次记录一下,方便以后用时查阅。
直接上一下scipy.singal里面关于iir二阶陷波滤波器的函数定义说明:
def iirnotch(w0, Q):
    """
    Design second-order IIR notch digital filter.

    A notch filter is a band-stop filter with a narrow bandwidth
    (high quality factor). It rejects a narrow frequency band and
    leaves the rest of the spectrum little changed.

    Parameters
    ----------
    w0 : float
        Normalized frequency to remove from a signal. It is a
        scalar that must satisfy  ``0 < w0 < 1``, with ``w0 = 1``
        corresponding to half of the sampling frequency.
    Q : float
        Quality factor. Dimensionless parameter that characterizes
        notch filter -3 dB bandwidth ``bw`` relative to its center
        frequency, ``Q = w0/bw``.

    Returns
    -------
    b, a : ndarray, ndarray
        Numerator (``b``) and denominator (``a``) polynomials
        of the IIR filter.
可以看到,函数有两个输入,分别是要滤掉的频率,滤波器的质量因子。具体参数的表示见下面示例代码注释。
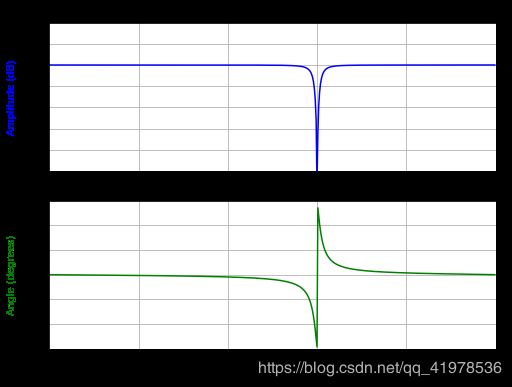
下面看一个具体陷波滤波器的使用并绘制其频率响应的例子:
    #Design and plot filter to remove the 60Hz component from a
    signal sampled at 200Hz, using a quality factor Q = 30

    >>> from scipy import signal
    >>> import numpy as np
    >>> import matplotlib.pyplot as plt

    >>> fs = 200.0  # Sample frequency (Hz)
    >>> f0 = 60.0  # Frequency to be removed from signal (Hz)
    >>> Q = 30.0  # Quality factor
    >>> w0 = f0/(fs/2)  # Normalized Frequency
    >>> # Design notch filter
    >>> b, a = signal.iirnotch(w0, Q)

    >>> # Frequency response
    >>> w, h = signal.freqz(b, a)
    >>> # Generate frequency axis
    >>> freq = w*fs/(2*np.pi)
    >>> # Plot
    >>> fig, ax = plt.subplots(2, 1, figsize=(8, 6))
    >>> ax[0].plot(freq, 20*np.log10(abs(h)), color='blue')
    >>> ax[0].set_title("Frequency Response")
    >>> ax[0].set_ylabel("Amplitude (dB)", color='blue')
    >>> ax[0].set_xlim([0, 100])
    >>> ax[0].set_ylim([-25, 10])
    >>> ax[0].grid()
    >>> ax[1].plot(freq, np.unwrap(np.angle(h))*180/np.pi, color='green')
    >>> ax[1].set_ylabel("Angle (degrees)", color='green')
    >>> ax[1].set_xlabel("Frequency (Hz)")
    >>> ax[1].set_xlim([0, 100])
    >>> ax[1].set_yticks([-90, -60, -30, 0, 30, 60, 90])
    >>> ax[1].set_ylim([-90, 90])
    >>> ax[1].grid()
    >>> plt.show()
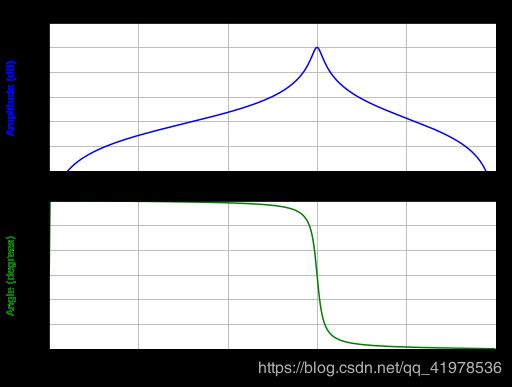
    #Design and plot filter to remove the frequencies other than the 300Hz
    component from a signal sampled at 1000Hz, using a quality factor Q = 30

    >>> from scipy import signal
    >>> import numpy as np
    >>> import matplotlib.pyplot as plt

    >>> fs = 1000.0  # Sample frequency (Hz)
    >>> f0 = 300.0  # Frequency to be retained (Hz)
    >>> Q = 30.0  # Quality factor
    >>> w0 = f0/(fs/2)  # Normalized Frequency
    >>> # Design peak filter
    >>> b, a = signal.iirpeak(w0, Q)

    >>> # Frequency response
    >>> w, h = signal.freqz(b, a)
    >>> # Generate frequency axis
    >>> freq = w*fs/(2*np.pi)
    >>> # Plot
    >>> fig, ax = plt.subplots(2, 1, figsize=(8, 6))
    >>> ax[0].plot(freq, 20*np.log10(abs(h)), color='blue')
    >>> ax[0].set_title("Frequency Response")
    >>> ax[0].set_ylabel("Amplitude (dB)", color='blue')
    >>> ax[0].set_xlim([0, 500])
    >>> ax[0].set_ylim([-50, 10])
    >>> ax[0].grid()
    >>> ax[1].plot(freq, np.unwrap(np.angle(h))*180/np.pi, color='green')
    >>> ax[1].set_ylabel("Angle (degrees)", color='green')
    >>> ax[1].set_xlabel("Frequency (Hz)")
    >>> ax[1].set_xlim([0, 500])
    >>> ax[1].set_yticks([-90, -60, -30, 0, 30, 60, 90])
    >>> ax[1].set_ylim([-90, 90])
    >>> ax[1].grid()
    >>> plt.show()

参考资料
https://github.com/scipy/scipy/blob/master/scipy/signal/filter_design.py
有兴趣的可以去看看,里面各种滤波器都有。
