回归及表示
import tensorflow as tf
tf.test.is_gpu_available()
import numpy as np
import matplotlib.pyplot as plt
plt.rcParams['font.sans-serif'] = ['SimHei']
一元线性
x = tf.constant([137,104,100,124,79,99,124.,114,106,138,53,46,68,63,81,86])
y = tf.constant([145.,110,93,116,65,104,118,91,62,133,51,45,78,69,75,95])
x.shape,y.shape
meanX = tf.reduce_mean(x)
meanY = tf.reduce_mean(y)

sumXY = tf.reduce_sum((x-meanX)*(y-meanY))
sunX = tf.reduce_sum((x-meanX)*(x-meanX))

w = sumXY/sunX
b = meanY - w*meanX
x_test = np.array([128,15,45,141,106,99.,53,85,70])
y_pred = (w*x_test+b)
拟合
plt.figure
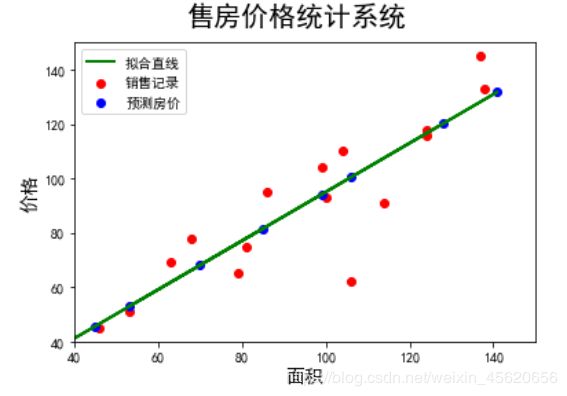
plt.scatter(x,y,color='r',label='销售记录')
plt.scatter(x_test,y_pred,color='b',label='预测房价')
plt.plot(x_test,y_pred,color='g',label='拟合直线',linewidth=2)

plt.xlabel('面积',fontsize=14)
plt.ylabel('价格',fontsize=14)
plt.xlim((40,150))
plt.ylim((40,150))

plt.suptitle('售房价格统计系统',fontsize=20)
plt.legend(loc='upper left')
plt.show()

多元线性
x1 = np.array([137,104,100,124,79,99,124.,114,106,138,53,46,68,63,81,86])
x2 = np.array([3,2,2,3,1,2,3,2,2,3,1,1,1,1,2,2])
y = np.array([145,110.,93,116,65,104,118,91,62,113,51,45,78,69,75,95])
x1.shape,x2.shape,y.shape
x0 = np.ones(len(x1))
X = np.stack((x0,x1,x2),axis=1)
Y = y.reshape(-1,1)
Xt = np.transpose(X)
XtX_1 = np.linalg.inv(np.matmul(Xt,X))
XtX_1_Xt = np.matmul(XtX_1,Xt)
W= np.matmul(XtX_1_Xt,Y)
W.reshape(-1)
x1_test = 140
x2_test = 3
y_pred = W[0] + W[1]*x1_test + W[2]*x2_test
y_pred
三维数据可视化
from mpl_toolkits.mplot3d import Axes3D
ax3d = Axes3D(plt.figure())
plt.show()
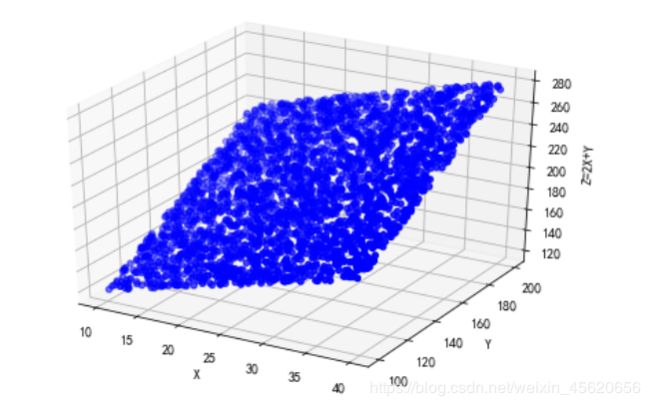
x = np.random.uniform(10,40,3000)
y = np.random.uniform(100,200,3000)
z = 2*x + y
ax3d = Axes3D(plt.figure())
ax3d.scatter(x,y,z,c='b')
ax3d.set_xlabel('X')
ax3d.set_ylabel('Y')
ax3d.set_zlabel('Z=2X+Y')
plt.show()

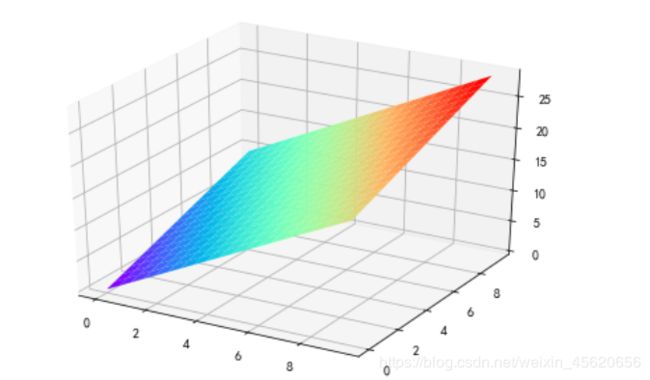
a = np.arange(0,10,0.5)
b = np.arange(0,10,0.5)
X,Y = np.meshgrid(a,b)
Z = 2*X + Y
ax3d_1 = Axes3D(plt.figure())
ax3d_1.plot_surface(X,Y,Z,cmap='rainbow')
plt.show()


