Windows Mobile应用程序异常问题定位指南
Windows Mobile Application Crash Trouble Shooting Manual
| Doc.id.: |
RC_WIN_WM_0001 |
| Issue date: |
2009-02-09 |
| Issued by: |
Ryan Chen(Xiaofeng Chen) |
| Status: |
|
DOCUMENT INFORMATIONThis document is a summary for windows mobile crash issues handling experience which accumualted from daily work, these technical points explained in this document are applied to windows mobile 5.x 6.x series platform. Hope it helps.
Definitions
Abbreviations
| SLOT |
The lower address space of WM is split into 32 slots |
| VM |
Virtual Memory |
| RAM |
RAM is the physical resource each process consumes to fill memory requests. When the process loads resources and commits memory, RAM is then “consumed” to fill this need. For example, each process starts with a default heap that is created within your virtual memory area. It grows as your application allocates objects and as a result, consumes memory out of the available system RAM and begins to use up your 32MB address space. |
| XIP |
eXecute in place |
Document History
| Version |
Date |
Author |
Description |
| 1 |
2009-02-09 |
Ryan Chen |
First draft for review |
|
|
|
|
|
|
|
|
|
|
Contents List
1 Introduction...................................................................................................................................................................... 5
2 Background........................................................................................................................................................................ 6
3 Exception handling........................................................................................................................................................ 7
4 Resolve symbols for addresses.......................................................................................................................... 8
4.1 Crash Log.............................................................................................................................................................................. 8
4.2 Map File................................................................................................................................................................................ 9
5 References.......................................................................................................................................................................... 13
1 Introduction
One of the most common problems for windows application is crash, so windows mobile is. Usually the reason is as access violation caused by null or uninitialized or wild pointer. If we have the debug version on hand, and the crash could be easily reproduced then it will not trouble us too much. But if this is reported by a certain released version running on a real productive system, which means it is impossible for programmer to debug then we have to catch the unhandled exceptions for generating crash logs or dump files, and we could use some tools to analyze the crash logs or dump files like windbg. In this article I will not speak of dump files, instead I am trying to explain the way of using map file and crash logs to catch the exact line of codes.
2 Background
First of all, it is quite helpful to introduce a bit the memory management of windows mobile system. We just need to know some basics of VM mechanism. Windows CE 5 (which does the memory management) is the basis for both Windows Mobile 5.x and Windows Mobile 6.x. Windows CE 6 will supposedly be the basis for the future Windows Mobile 7(which is out of scope for this article). For Windows CE 5, only 32 applications can exist, and each can normally only access 32 megabytes of virtual memory. Windows CE 5 keeps all the process’s address spaces available at all times, what it means the lower 1GB (0x4000000) application address space is split into 32 slots.
· Slot 0 is 0x00000000 through 0x01FFFFFF
· Slot 1 is 0x02000000 through 0x03FFFFFF
……
I paste a picture below for a global view.
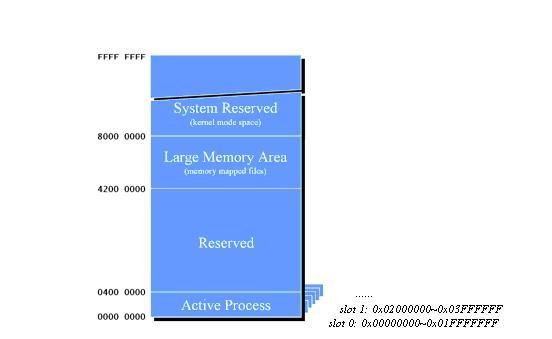
Figure 1 Windows CE Virtual Memory Space
Slots 0 & 1 are special slots that aren’t used by processes. The current process is always mapped into slot 0 in addition to having its own unique slot. All DLLs that are stored in ROM (XIP DLLs) are loaded in slot 1.
3 Exception handling
Now we know how Windows Mobile manages memory. This is essential for us to understand well the process addresses. But before we could analyze any practical addresses, we need firstly capture them at the moment of exception happening. This is what exception handling mechanism should do. MS has already provided a structured exception handling mechanism try-except statement for 32-bit target applications.
__try
{
// guarded code
}
__except (expression)
{
// exception handler code
}
And in addition MS also provides some useful APIs for us to take a snapshot of the machine state:
Ø GetExceptionCode -> Retrieves a code that identifies the type of the exception that occurred.
Ø GetExceptionInformation -> This function retrieves a machine-independent description of an exception and information about the machine state that existed for the thread when the exception occurred.
Ø GetThreadCallStack -> This function retrieves the call stack of an arbitrary thread in the system.
Now we get everything for handling an exception, what we should do next is just replace the expression above to be our specific function returns required value. The function could be designed as an exception filter or logger. The following codes demo how the expression works with a logger:
__except( LogStructuredException( GetExceptionInformation() )
// Logger implementation pseudo code
int LogStructuredException( EXCEPTION_POINTERS *pExcept )
{
// open the log file
pFile = OpenLogFile(logpath+filename);
// log the exception info
Dump( pFile, pExcept->ExceptionRecord->ExceptionCode, pExcept->ExceptionRecord->ExceptionAddress, pExcept->ExceptionRecord->ExceptionFlags, pExcept->ExceptionRecord->NumberParameters ); }
// log the call stack info
Dump( GetThreadStack(…))
}
4 Resolve symbols for addresses
Well, if we’ve had the above exception logger in our application already. And if the exception did happen, we definitely could get a crash log sent from support or tester. That is to say we had the addresses information on hand now. However the address is hex value, it is still not easy for us to know what’s wrong with our application. We should use symbol files to map those addresses to source codes.
With Windows Mobile memory basics, crash log and map file, we are finally able to locate exactly the crash code line. I will explain in details with a demo log and map file.
4.1 Crash Log
Here is a demo Crash Log:
Exception c0000005 occured at code_address 00016e00 (flags=00000000, num_params=00000002)
-> except_info[0]=00000000
-> except_info[1]=1e000008
-------------------------------------------
Stacktrace:
-------------------------------------------
dwReturnAddr: 03f69b7c, dwCurProc: bf1cf29a, dwFramePtr: 1e5be2d4, dwParams[0]: 1e5be1ac, dwParams[1]: 00000001, dwParams[2]: 9f270ac0, dwParams[3]: 9ec885ac
dwReturnAddr: 1e0f8e94, dwCurProc: bf1cf29a, dwFramePtr: 1e5be2e8, dwParams[0]: 1e5be1ac, dwParams[1]: 00000001, dwParams[2]: 9f270ac0, dwParams[3]: 9ec885ac
dwReturnAddr: 1e0f96d8, dwCurProc: bf1cf29a, dwFramePtr: 1e5be3ac, dwParams[0]: 1e5be1ac, dwParams[1]: 00000001, dwParams[2]: 9f270ac0, dwParams[3]: 9ec885ac
dwReturnAddr: 1e03a4d4, dwCurProc: bf1cf29a, dwFramePtr: 1e5be438, dwParams[0]: 1e5be1ac, dwParams[1]: 00000001, dwParams[2]: 9f270ac0, dwParams[3]: 9ec885ac
dwReturnAddr: 03f8b924, dwCurProc: bf1cf29a, dwFramePtr: 1e5be440, dwParams[0]: 1e5be1ac, dwParams[1]: 00000001, dwParams[2]: 9f270ac0, dwParams[3]: 9ec885ac
dwReturnAddr: 03f91d60, dwCurProc: bf1cf29a, dwFramePtr: 1e5be464, dwParams[0]: 1e5be1ac, dwParams[1]: 00000001, dwParams[2]: 9f270ac0, dwParams[3]: 9ec885ac
dwReturnAddr: 88037dc4, dwCurProc: bf1cf29a, dwFramePtr: 1e5be48c, dwParams[0]: 1e5be1ac, dwParams[1]: 00000001, dwParams[2]: 9f270ac0, dwParams[3]: 1e5be73c
dwReturnAddr: 88064504, dwCurProc: bf1cf29a, dwFramePtr: 1e5be49c, dwParams[0]: 1e5be1ac, dwParams[1]: 00000001, dwParams[2]: 9f270ac0, dwParams[3]: 1e5be73c
dwReturnAddr: 8803be44, dwCurProc: bf1cf29a, dwFramePtr: 1e5be70c, dwParams[0]: 1e5be1ac, dwParams[1]: 00000001, dwParams[2]: 9f270ac0, dwParams[3]: 1e5be73c
dwReturnAddr: 88037cdc, dwCurProc: bf1cf29a, dwFramePtr: 1e5be7b0, dwParams[0]: 20000010, dwParams[1]: 00000001, dwParams[2]: 9f270ac0, dwParams[3]: 1e5be73c
dwReturnAddr: 1e016e00, dwCurProc: bf1cf29a, dwFramePtr: 1e5be8e4, dwParams[0]: 00000008, dwParams[1]: 00000001, dwParams[2]: 9f270ac0, dwParams[3]: 1e5be73c
dwReturnAddr: 1e016660, dwCurProc: bf1cf29a, dwFramePtr: 1e5be8f4, dwParams[0]: 1e5be918, dwParams[1]: 00000001, dwParams[2]: 9f270ac0, dwParams[3]: 1e5be73c
dwReturnAddr: 1e084ea4, dwCurProc: bf1cf29a, dwFramePtr: 1e5be908, dwParams[0]: 000869d4, dwParams[1]: 00000001, dwParams[2]: 9f270ac0, dwParams[3]: 1e5be73c
dwReturnAddr: 1e0644c8, dwCurProc: bf1cf29a, dwFramePtr: 1e5beac8, dwParams[0]: 0069a1c0, dwParams[1]: 00000110, dwParams[2]: 00000000, dwParams[3]: 00000000
……
The most useful information is exception code address (represents where it crashed) and dwReturnAddr (the return address represents the next line of codes if this exception would not happen).
Ø Exception code address: represents where it crashed;
Ø dwReturnAddr: it is the return address which represents the next line of codes if this exception would not happen;
Ø dwFramePrt: frame pointer, which points to a fixed point in the "user" stack and points to a location in the stack where the arguments and local variables for a called function are located. This pointer is established upon entry to a function and remains constant throughout the execution of the called function.
Ø except_info[0]: for EXCEPTION_ACCESS_VIOLATION only, read/write mode
Ø except_info[1]: for EXCEPTION_ACCESS_VIOLATION only, the memory address that was accessed to cause the problem.
4.2 Map File
Here is part of a corresponding demo Map File:
z7client
Timestamp is 498fe506 (Mon Feb 09 16:10:46 2009)
Preferred load address is 00010000
Start Length Name Class
0001:00000000 00333200H .text CODE
0001:00333200 000058ecH .text$yc CODE
0001:00338aec 000009b0H .text$yd CODE
0002:00000000 00117536H .rdata DATA
0002:00117538 000000abH .rdata$debug DATA
0002:001175e4 000009a0H .xdata DATA
0002:00117f84 00000034H .xdata$x DATA
0002:00117fb8 00000004H ATL$__a DATA
0002:00117fbc 00000004H ATL$__z DATA
0002:00117fc0 000000dcH .idata$2 DATA
0002:0011809c 00000014H .idata$3 DATA
0002:001180b0 000006b0H .idata$4 DATA
0002:00118760 0000043eH .idata$6 DATA
0002:00118b9e 00000000H .edata DATA
0003:00000000 000006b0H .idata$5 DATA
0003:000006b0 00000004H .CRT$XCA DATA
0003:000006b4 00000004H .CRT$XCAA DATA
0003:000006b8 00000008H .CRT$XCL DATA
0003:000006c0 00000040H .CRT$XCU DATA
0003:00000700 00000004H .CRT$XCZ DATA
0003:00000704 00000004H .CRT$XIA DATA
0003:00000708 00000004H .CRT$XIZ DATA
0003:0000070c 00000004H .CRT$XPA DATA
0003:00000710 00000004H .CRT$XPZ DATA
0003:00000714 00000004H .CRT$XTA DATA
0003:00000718 00000004H .CRT$XTZ DATA
0003:00000720 00001aa4H .data DATA
0003:000021c8 000015f5H .bss DATA
0004:00000000 0004c578H .pdata DATA
0005:00000000 00000598H .rsrc$01 DATA
0005:000005a0 00004c80H .rsrc$02 DATA
Address Publics by Value Rva+Base Lib:Object
……
0001:00005d8c ?c_str@?$Z7NonRefStringT@_WV?$Z7MemOptimizedStringAllocator@_W@@@@QBAPB_WXZ 00016d8c f i AppClientUtil.obj
0001:00005dec ?c_str@?$Z7NonRefStringT@_WV?$Z7MemOptimizedStringAllocator@_W@@@@QAAPA_WXZ 00016dec f i AppClientUtil.obj
0001:00005e4c ?beginsWith@?$Z7NonRefStringT@_WV?$Z7MemOptimizedStringAllocator@_W@@@@QBA_NABV1@@Z 00016e4c f i AppClientUtil.obj
0001:00005f60 ?equals@?$Z7NonRefStringT@_WV?$Z7MemOptimizedStringAllocator@_W@@@@QBA_NABV1@_N@Z 00016f60 f i AppClientUtil.obj
0001:000061e0 ?format@?$Z7NonRefStringT@_WV?$Z7MemOptimizedStringAllocator@_W@@@@QAAAAV1@PB_WZZ 000171e0 f i AppClientUtil.obj
……
0001:00073370 ?InitPageContents@CRegContactsConfigPage@@MAAHXZ 00084370 f RegContactsConfigPage.obj
0001:00073790 ?InitControlContents@CRegContactsConfigPage@@MAAHXZ 00084790 f RegContactsConfigPage.obj
0001:000740e0 ?InitMenu@CRegContactsConfigPage@@UAAHXZ 000850e0 f RegContactsConfigPage.obj
……
0001:000e7df8 ?DumpCallStack@@YAXPAX@Z 000f8df8 f sdapi:Z7PlatformUtilCommon.obj
0001:000e7f6c ?DumpMemoryInfo@@YAXPAX@Z 000f8f6c f sdapi:Z7PlatformUtilCommon.obj
……
Ø Rva+Base: the starting address of the function
Ø Preferred load address: the base address you application loaded
Ø Publics by Value: the symbol name of functions
Ø Lib:Object: the module your function belongs to
I will now walk you through the steps of locating the code line of exception.
a) Locate the function containing the exception address
Usually you can extract the high part of exception address 00016e00, say 00016e and use this to scan down the map file Rva+Base column, in our case, we will find 00016e4c, this address is a bit bigger than exception address, so we step back to check the former function address, here it is 00016dec, since 00016e00 is between [00016dec, 00016e4c], we can make sure the application crashed in the function of 00016dec, i.e. Z7NonRefStringT::c_str function.
b) Locate the exact code line of address
To know the exact line of codes in Z7NonRefStringT::c_str function, we can generate ASM files through Project property->C/C++->Output files->Assembler Output: Assembly with Source Code (/FAs), with ASM file we could calculate the address ourselves by ARM instructions, yet it is a bit painful. An alternative way is to launch a remote debug, while it is debugging into this function, press shortcut ALT+8 to enable disassembly windows, we then could see the address directly, and from it we could conclude that the string object has not been well constructed or a null object:
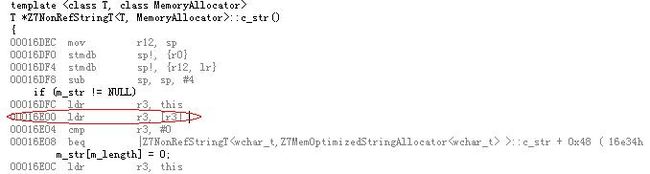
Figure 2 Disassembly codes of the function
c) Locate the return address
Even now we know where the crash happened, we may still be far away from the truth behind, because in our application, we most likely have lots of places called this specific function. So the question now for us is how to locate where it is called. We need to look further into the return address part of the crash logs. Per the memory management described in chapter 1, our application works within its own slot. From the exception information printed, we could see our process was working within slot 15: 0x1e000000~0x20000000, so we will just ignore the return addresses which are obviously not in the same frame as our currently codes. The first one in our scope is 0x1e0f8e94, since current process was loaded to slot 0, so the actual address should be 0x000f8e94(strip off the highest byte), then we still need to subtract the preferred load address and 0x1000(reserved for system use), so generally the hexadecimal arithmetic is as below:
((Return address) & 0x00111111)) – (Preferred load address) – 0x1000
And remember the searching rule:
The closest number that isn’t over the calculated value
In our case the offset result is 0x000e7e94, which from the map file it is in DumpCallStack function. Following the same way, we could deduce the address 0x1e0f96d8 is in LogStructuredException function, so it is obvious that the functions we printed at the top of the call stack are exception handling related. OK, go on with 0x1e03a4d4 , we could get function ProcessWindowMessage, 03fxxxx should be system calls, unfortunately we didn’t have enough OS symbols to get what system API it is.But it doesn’t matter too much. Then ignore 0x88xxxxxx addresses, it is in kernal mode space.so the next one is 0x1e016e00, we could get function Z7NonRefStringT::c_str(), notice this is where we crashed! It is close to the caller now! To make it clear, I list address and resolved symbols only from now on:
Return address Address offset Symbol
0x1e016660 0001:0x00005660 c_str@Z7String
0x1e084ea4 0001:0x00073ea4 InitControlContents@CRegContactsConfigPage (Note that 0001:00073ea4 is between 0001:00073790 and 0001:000740e0, the small one is what we are searching)
d) Checking the source codes
I simplify the codes here for a quick check:
BOOL CRegContactsConfigPage::InitControlContents()
{
Z7String strBrandId = map.getString(sBrandKey);
Replace(strTarget, strBrandId.c_str());
}
The logic is to find a brand string from a map by its key, in case of there is no string found, it will return a default null string object. In this case it will crash on c_str (). It is always correct to check if the strBrandId is null or we must use a string which is always initialized with a non-null value.
OK, we now finished the crash shooting trip, what else would be interesting? A small crash analyse tools might be more interesting. I am going to do it if I got time.
5 References
1. http://www.codeproject.com/KB/debug/mapfile.aspx
2. http://msdn.microsoft.com/en-us/library/ms836325.aspx.
3. http://blogs.msdn.com/ce_base/
4. http://blogs.msdn.com/sloh/archive/2005/02/25/380475.aspx
5. Advanced Windows Programming