Android自定义控件之折线图
前言
折线图是Android开发中经常会碰到的效果,但由于涉及自定义View的知识,对许多刚入门的小白来说会觉得很高深。其实不然,接下来我就以尽量通俗的语言来说明下图折线图效果的实现过程。
效果图
实现过程
首先,选择自定义控件的方式。
自定义控件的实现有四种方式:
1.继承View,重写onDraw、onMeasure等方法。
2.继承已有的View(比如TextView)。
3.继承ViewGroup实现自定义布局。
4.继承已有的ViewGroup(比如LinearLayout)。
由于我们不需要多个控件进行组合,也不需要在原有控件基础上改造,故我们采用第1种方式即继承View来实现。代码如下,新建一个ChartView类继承自View,并实现他的几个构造方法,并重写onDraw和onMeasure方法,因为我们要在onDraw方法里面进行绘制工作,并且我希望这个控件的长宽是相等的,所以在onMeasure方法设置宽高相等。设置长宽相等的方式很简单,我们不需要自己去测量实现,只需要调用父类的onMeasure方法,传参数(宽高值)时将都传入宽度(或者高度)即可。
public class ChartView extends View {

    public ChartView(Context context) {
        super(context);
    }

    public ChartView(Context context, @Nullable AttributeSet attrs) {
        super(context, attrs);
    }

    public ChartView(Context context, @Nullable AttributeSet attrs, int defStyleAttr) {
        super(context, attrs, defStyleAttr);
    }

    @Override
    protected void onMeasure(int widthMeasureSpec, int heightMeasureSpec) {
        super.onMeasure(widthMeasureSpec, widthMeasureSpec);
    }

    @Override
    protected void onDraw(Canvas canvas) {
        super.onDraw(canvas);
    }
}
其次,绘制简单图形并显示出来。
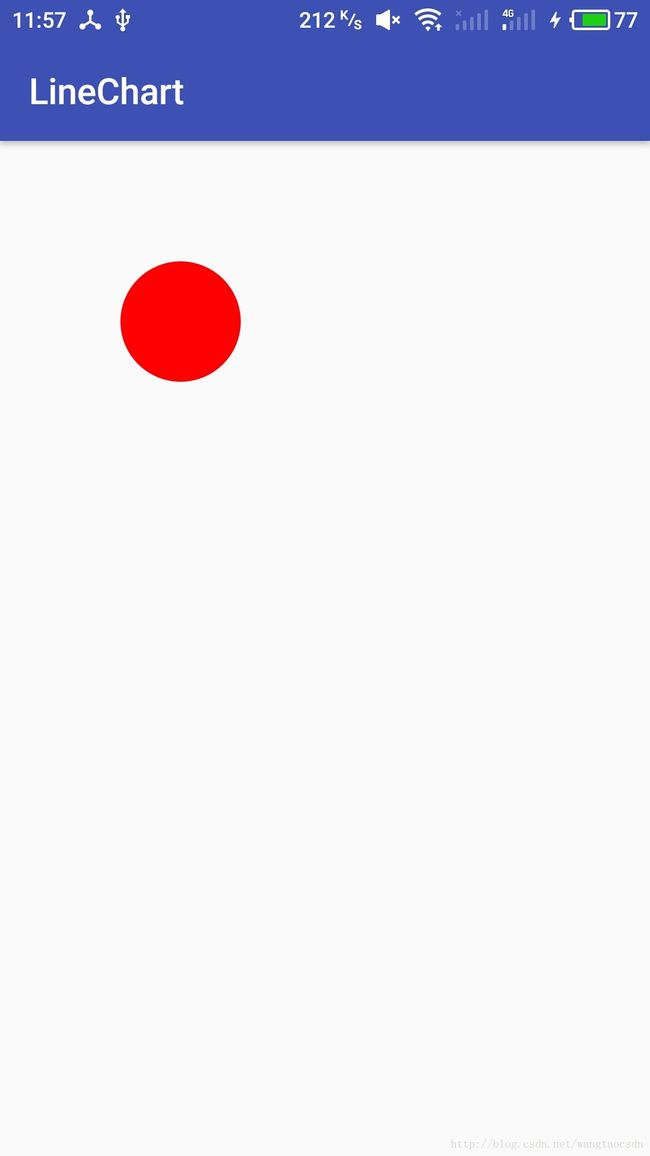
在进行绘制之前,我们要进行若干初始化工作,其中就包括画笔的初始化。然后就可以进行绘制了,我们先绘制一个简单的圆圈,然后将控件放到布局文件中,运行看看效果。
ChartView代码
public class ChartView extends View {

    // 画笔
    private Paint paint;

    /**
    *  构造函数
    */
    public ChartView(Context context) {
        super(context);
        initWork();
    }

    /**
    *  构造函数
    */
    public ChartView(Context context, @Nullable AttributeSet attrs) {
        super(context, attrs);
        initWork();
    }

    /**
    *  构造函数
    */
    public ChartView(Context context, @Nullable AttributeSet attrs, int defStyleAttr) {
        super(context, attrs, defStyleAttr);
        initWork();
    }

    /**
    *  初始化工作
    */
    private void initWork() {
        initPaint();
    }

    /**
    *  画笔设置
    */
    private void initPaint() {
        paint = new Paint(Paint.ANTI_ALIAS_FLAG);
        // 画笔样式为填充
        paint.setStyle(Paint.Style.FILL);
        // 颜色设为红色
        paint.setColor(Color.RED);
        // 宽度为3像素
        paint.setStrokeWidth(3);
    }

    @Override
    protected void onMeasure(int widthMeasureSpec, int heightMeasureSpec) {
        super.onMeasure(widthMeasureSpec, widthMeasureSpec);
    }

    @Override
    protected void onDraw(Canvas canvas) {
        super.onDraw(canvas);
        // 画圆
        canvas.drawCircle(300,300,100,paint);
    }
}
activity_main.xml
<android.support.constraint.ConstraintLayout
    xmlns:android="http://schemas.android.com/apk/res/android"
    android:layout_width="match_parent"
    android:layout_height="match_parent"

    <com.toprs.linechart.ChartView
        android:layout_width="match_parent"
        android:layout_height="match_parent"/>

android.support.constraint.ConstraintLayout>
效果:
然后,绘制图表。
到目前为止,已经实现了最简单的一个自定义控件,虽然它什么功能都没有,只是简单显示一个红色圆圈,但本质都是一样的。接下来就开始图表的绘制。
1.初始化一些需要使用的值。
    // 刻度之间的距离
    private int degreeSpace;
@Override
protected void onDraw(Canvas canvas) {
super.onDraw(canvas);
// 控件上下左右边界四至及控件的宽度(同时也是高度!)
int left = getLeft();
int right = getRight();
int top = getTop();
int bottom = getBottom();
int w = getWidth();
// 图表距离控件边缘的距离
int graphPadding = w / 10;
// 图表上下左右四至
int graphLeft = left + graphPadding;
int graphBottom = bottom - graphPadding;
int graphRight = right - graphPadding;
int graphTop = top + graphPadding;
// 图表宽度(也等同高度奥~)
int graphW = graphRight - graphLeft;
// 刻度之间的距离
degreeSpace = graphW / 8;
}2.灰色背景
    // 背景
    canvas.drawColor(Color.LTGRAY);
3.坐标系
    // 画笔设置样式为STROKE样式,即只划线不填充
    paint.setStyle(Paint.Style.STROKE);

    // 坐标系绘制
    Path pivotPath = new Path();
    //Y轴
    pivotPath.moveTo(graphLeft, graphBottom);
    pivotPath.lineTo(graphLeft, graphTop);
    //Y轴箭头
    pivotPath.lineTo(graphLeft - 12, graphTop + 20);
    pivotPath.moveTo(graphLeft, graphTop);
    pivotPath.lineTo(graphLeft + 12, graphTop + 20);
    //X轴
    pivotPath.moveTo(graphLeft, graphBottom);
    pivotPath.lineTo(graphRight, graphBottom);
    //X轴箭头
    pivotPath.lineTo(graphRight - 20, graphBottom + 12);
    pivotPath.moveTo(graphRight, graphBottom);
    pivotPath.lineTo(graphRight - 20, graphBottom - 12);
    canvas.drawPath(pivotPath, paint);
4.刻度虚线及数字
    // Y轴刻度虚线
    for (int i = 1; i < 8; i++) {
        Path yKeduPath = new Path();
        // 线
        paint.setColor(Color.WHITE);
        paint.setStrokeWidth(1);
        paint.setStyle(Paint.Style.STROKE);
        paint.setPathEffect(new DashPathEffect(new float[]{5,5},0));
        yKeduPath.moveTo(graphLeft, graphBottom - i * degreeSpace);
        yKeduPath.lineTo(graphRight, graphBottom - i * degreeSpace);
        canvas.drawPath(yKeduPath, paint);
        // 数字
        paint.setColor(Color.BLACK);
        paint.setStyle(Paint.Style.FILL);
        paint.setTextSize(25);
        paint.setPathEffect(null);
        canvas.drawText(i + "", graphPadding / 2, graphBottom - i * degreeSpace, paint);
    }
    // X轴刻度虚线
    for (int i = 1; i < 8; i++) {
        Path xKeduPath = new Path();
        // 线
        paint.setColor(Color.WHITE);
        paint.setStyle(Paint.Style.STROKE);
        paint.setStrokeWidth(1);
        paint.setPathEffect(new DashPathEffect(new float[]{5,5},0));
        xKeduPath.moveTo(graphLeft + i * degreeSpace, graphBottom);
        xKeduPath.lineTo(graphLeft + i * degreeSpace, graphTop);
        canvas.drawPath(xKeduPath, paint);
        // 数字
        paint.setColor(Color.BLACK);
        paint.setStyle(Paint.Style.FILL);
        paint.setTextSize(25);
        paint.setPathEffect(null);
        canvas.drawText(i + "", graphLeft + i * degreeSpace, graphBottom + graphPadding / 2, paint);
    }
5.折线
在绘制折线之前,我们先要初始化几个参数。
    // 模拟数据
    private float[] data = {3.2f, 4.3f, 2.5f, 3.2f, 3.8f, 7.1f, 1.3f, 5.6f};
    // 当前显示的数据数量
    private int showNum=1;
// 折线
Path linePath = new Path();
for (int i = 0; i < showNum; i++) {
int toPointX = graphLeft + i * degreeSpace;
int toPointY = graphBottom - ((int) (data[i] * degreeSpace));
paint.setColor(Color.YELLOW);
paint.setStyle(Paint.Style.STROKE);
if (i==0){
linePath.moveTo(toPointX,toPointY);
}else {
linePath.lineTo(toPointX, toPointY);
}
// 节点圆圈
canvas.drawCircle(toPointX, toPointY,10,paint);
paint.setColor(Color.WHITE);
paint.setStyle(Paint.Style.FILL);
canvas.drawCircle(toPointX,toPointY,7,paint);
}
paint.setColor(Color.YELLOW);
paint.setStyle(Paint.Style.STROKE);
paint.setStrokeWidth(3);
canvas.drawPath(linePath, paint);6.让图表动起来
为了实现数据依次显现的动画,我们开启一个线程是当前显示的数据数量即showNum变量不断加一,并间隔时间0.5秒。然后postInvalidate()重绘即可。
    private void initWork() {
        initPaint();
        // 开启线程,没隔0.5秒showNum加一
        new Thread(new Runnable() {
            @Override
            public void run() {
                while (true){
                    if (showNumelse {
                        showNum=1;
                    }
                    // 重绘
                    postInvalidate();
                    // 休眠0.5秒
                    try {
                        Thread.sleep(500);
                    } catch (InterruptedException e) {
                        e.printStackTrace();
                    }
                }
            }
        }).start();
    }
好了,运行一下,便会实现上面的效果了。如果你觉得效果不够炫酷或者功能太少,那就自己完善吧~~
结语
由于自定义控件是Android进阶路上必然要碰到的知识,所以希望大家重视。其实自定义控件说难也难说简单也简单。实现一些普通的效果还是很方便的,像这次举的例子,但如果要实现各种炫酷效果并且要完善各种功能的话,就需要各种知识的配合了,包括数学、物理、绘图等知识。所以还是需要平时不断积累的,看到别人的控件很棒的时候自己可以试着去实现一下,对自己的知识库不断进行补充,自然会娴熟的运用。本人也是菜鸟一枚,望共勉!!
