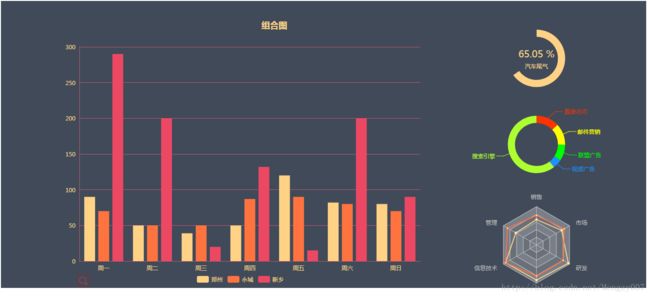
echarts-组合图
<html lang="en">
<head>
    <meta charset="UTF-8">
    <title>echarts.js案例一title>
    <script type="text/javascript" src='lib/echarts/dist/echarts.js'>script>
head>
<body>
    <div id="chart" style="width:100%;height:600px;">div>
body>
<script type="text/javascript">
    // 初始化图表标签
    var myChart = echarts.init(document.getElementById('chart'));


    var placeHolderStyle = {
        normal: {
            label: {
                show: false,
                position: "center"
            },
            labelLine: {
                show: false
            },
            color: "#dedede",
            borderColor: "#dedede",
            borderWidth: 0
        },
        emphasis: {
            color: "#dedede",
            borderColor: "#dedede",
            borderWidth: 0
        }
    };
    var options = {
        backgroundColor: "#404A59",
        color: ['#ffd285', '#ff733f', '#ec4863'],

        title: [{
            text: '组合图',
            left: '40%',
            top: '6%',
            textStyle: {
                color: '#ffd285'
            }
        }],
        tooltip: {
            /*trigger: 'item',
            formatter: "{a}
{b} : {c}"
            formatter: function(params) {
                //return params.seriesType
                //return params.name+':'+params.value
            }*/
        },
        legend: {
            x: '30%',
            bottom: '1%',
            textStyle: {
                color: '#ffd285',
            },
            data: ['郑州', '永城', '新乡']
        },
        radar: {
            // shape: 'circle',
            indicator: [{
                name: '销售',
                max: 6500
            }, {
                name: '管理',
                max: 16000
            }, {
                name: '信息技术',
                max: 30000
            }, {
                name: '客服',
                max: 38000
            }, {
                name: '研发',
                max: 52000
            }, {
                name: '市场',
                max: 25000
            }],
            center: ['83%', '85%'],
            radius: 80
        },
        grid: {
            left: '10%',
            right: '35%',
            top: '16%',
            bottom: '6%',
            containLabel: true
        },
        toolbox: {
            "show": false,
            feature: {
                saveAsImage: {}
            }
        },
        xAxis: {
            type: 'category',
            "axisLine": {
                lineStyle: {
                    color: '#c0576d'
                }
            },
            "axisTick": {
                "show": false
            },
            axisLabel: {
                textStyle: {
                    color: '#ffd285'
                }
            },
            boundaryGap: true, //false时X轴从0开始
            data: ['周一', '周二', '周三', '周四', '周五', '周六', '周日']
        },
        yAxis: {
            "axisLine": {
                lineStyle: {
                    color: '#c0576d'
                }
            },
            splitLine: {
                show: true,
                lineStyle: {
                    color: '#c0576d'
                }
            },
            "axisTick": {
                "show": false
            },
            axisLabel: {
                textStyle: {
                    color: '#ffd285'
                }
            },
            type: 'value'
        },
        series: [{
                name: '郑州',
                smooth: true,
                type: 'bar',
                symbolSize: 8,
                //symbol: 'circle',
                data: [90, 50, 39, 50, 120, 82, 80]
            }, {
                name: '永城',
                smooth: true,
                type: 'bar',
                symbolSize: 8,
                //symbol: 'circle',
                data: [70, 50, 50, 87, 90, 80, 70]
            }, {
                name: '新乡',
                smooth: true,
                type: 'bar',
                symbolSize: 8,
                //symbol: 'circle',
                data: [290, 200, 20, 132, 15, 200, 90]
            }, {
                type: 'pie',
                center: ['83%', '20%'],
                radius: ['15%', '20%'],
                tooltip: {
                    trigger: 'item',
                    formatter: "{a}
{b} : {c} ({d}%)"
                },
                label: {
                    normal: {
                        position: 'center'
                    }
                },
                data: [{
                    value: 335,
                    name: '污染来源分析',
                    itemStyle: {
                        normal: {
                            color: '#ffd285'
                        }
                    },
                    label: {
                        normal: {
                            formatter: '{d} %',
                            textStyle: {
                                color: '#ffd285',
                                fontSize: 20

                            }
                        }
                    }
                }, {
                    value: 180,
                    name: '占位',
                    tooltip: {
                        show: false
                    },
                    itemStyle: {
                        normal: {
                            color: '#404A59'
                        }
                    },
                    label: {
                        normal: {
                            textStyle: {
                                color: '#ffd285',
                            },
                            formatter: '\n汽车尾气'
                        }
                    }
                }]
            }, {
                type: 'pie',
                center: ['83%', '50%'],
                radius: ['15%', '20%'],
                name: '饼图',
                tooltip: {
                    trigger: 'item',
                    formatter: "{a}
{b} : {c} ({d}%)"
                },
                /* label: {
                         normal: {
                             textStyle: {
                                 color: '#ffd285',
                             },
                             formatter: "{b}: {c} ({d}%)"
                         }
                     },*/
                data: [{
                    value: 335,
                    name: '直接访问',
                    itemStyle: {
                        normal: {
                            color: '#FF3300'
                        }
                    }
                }, {
                    value: 310,
                    name: '邮件营销',
                    itemStyle: {
                        normal: {
                            color: '#FFFF00'
                        }
                    }
                }, {
                    value: 234,
                    name: '联盟广告',
                    itemStyle: {
                        normal: {
                            color: '#00FF00'
                        }
                    }
                }, {
                    value: 135,
                    name: '视频广告',
                    itemStyle: {
                        normal: {
                            color: '#1E90FF'
                        }
                    }
                }, {
                    value: 1548,
                    name: '搜索引擎',
                    itemStyle: {
                        normal: {
                            color: '#ADFF2F'
                        }
                    }
                }]
            },

            {
                type: 'radar',
                center: ['83%', '85%'],
                //radius: ['15%', '20%'],
                //name: '雷达',
                tooltip: {

                },
                data: [{
                    value: [4300, 10000, 28000, 35000, 50000, 19000],
                    name: '预算分配'
                }, {
                    value: [5000, 14000, 28000, 31000, 42000, 21000],
                    name: '实际开销'
                }]
            }
        ]
    }
    myChart.setOption(options);
script>
html>