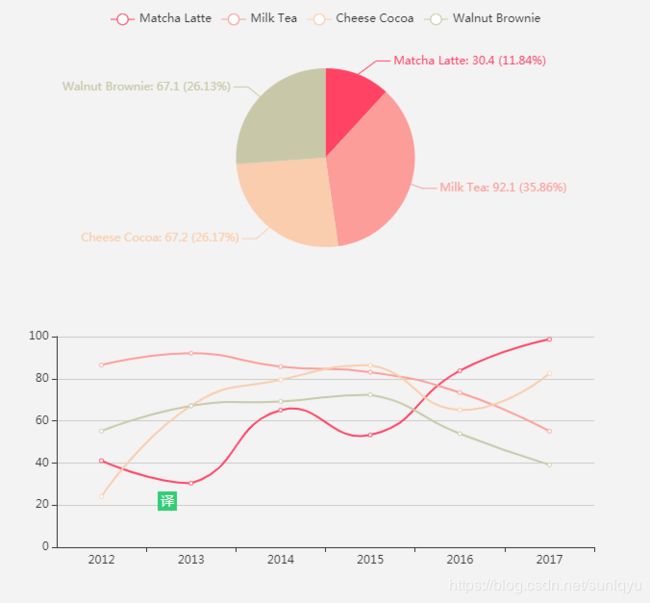
关于echartsjs的颜色和换行
setTimeout(function () {
option = {
legend: {},
tooltip: {
trigger: 'axis',
showContent: false
},
color: ['rgb(254,67,101)','rgb(252,157,154)','rgb(249,205,173)','rgb(200,200,169)','rgb(131,175,155)'], //对饼状图的颜色进行修改
dataset: {
source: [
['product', '2012', '2013', '2014', '2015', '2016', '2017'],
['Matcha Latte', 41.1, 30.4, 65.1, 53.3, 83.8, 98.7],
['Milk Tea', 86.5, 92.1, 85.7, 83.1, 73.4, 55.1],
['Cheese Cocoa', 24.1, 67.2, 79.5, 86.4, 65.2, 82.5],
['Walnut Brownie', 55.2, 67.1, 69.2, 72.4, 53.9, 39.1]
]
},
xAxis: {type: 'category'},
yAxis: {gridIndex: 0},
grid: {top: '55%'},
series: [
{type: 'line', smooth: true, seriesLayoutBy: 'row'},
{type: 'line', smooth: true, seriesLayoutBy: 'row'},
{type: 'line', smooth: true, seriesLayoutBy: 'row'},
{type: 'line', smooth: true, seriesLayoutBy: 'row'},
{
type: 'pie',
id: 'pie',
radius: '30%',
center: ['50%', '25%'],
label: {
formatter: '{b}: {@2012} \n ({d}%)' //这行中的\n是对图表中的数据进行换行的
},
encode: {
itemName: 'product',
value: '2012',
tooltip: '2012'
}
}
]
};
myChart.on('updateAxisPointer', function (event) {
var xAxisInfo = event.axesInfo[0];
if (xAxisInfo) {
var dimension = xAxisInfo.value + 1;
myChart.setOption({
series: {
id: 'pie',
label: {
formatter: '{b}: {@[' + dimension + ']} ({d}%)'
},
encode: {
value: dimension,
tooltip: dimension
}
}
});
}
});
myChart.setOption(option);
});
颜色和换行修改查看注释
