机器学习——决策树(2020最新版)
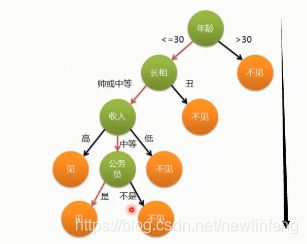
1、什么是决策树(Decision Tree)
2、决策树算法发展
3、决策树的例子
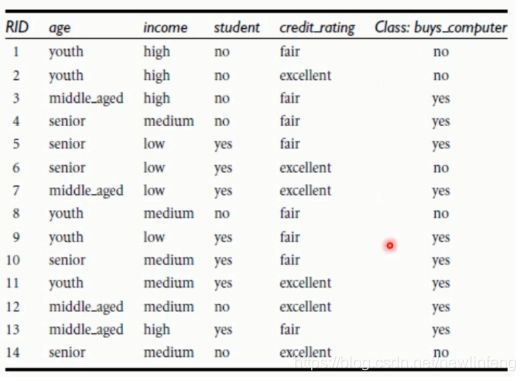
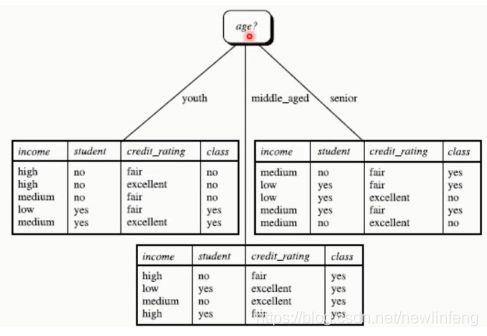
根据age、income、student、credit_rating属性来推断是否会买电脑:
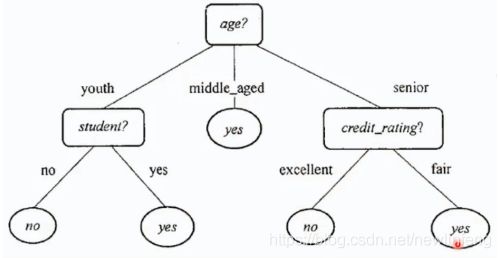
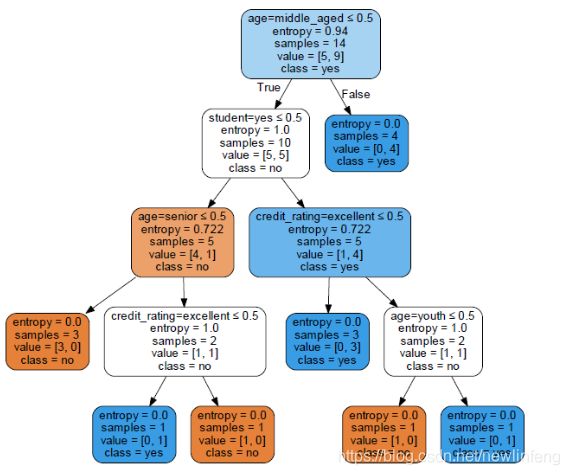
然后画出如下的决策树:
4、熵(entropy)的概念
(1) 熵其实可以代表不确定性,如果一个事情的熵越大,代表不确定性越大;熵越小,说明事情是比较确定的。
4.1 信息熵的计算
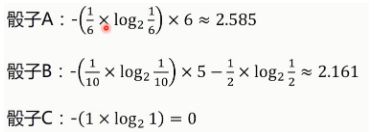
所以分别得到骰子A、B、C的信息熵:
所以有骰子ABC可知,信息熵越大,不确定性越大。
5、ID3算法(选择根节点的算法)
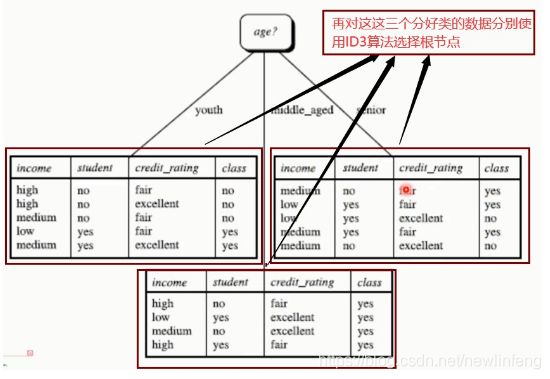
(1) 把信息增益最大的那个作为根节点,如下图,age的信息增益最大,为0.246,即age为根节点。
再分别累计使用ID3算法选择下一个节点的根节点:
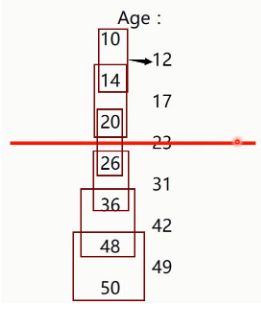
6、连续变量的处理、C4.5算法的提出
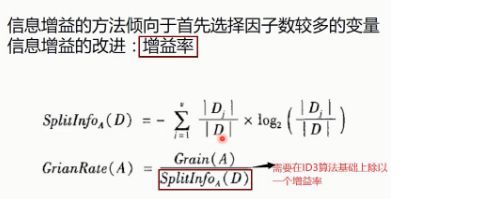
(2) ID3算法比较倾向选择分支数(属性值)比较多的那个参数(下面图中age是三个属性值,而students、credit-rating、income都只有两个属性值)
而为了优化这种倾向于选择因子数较多的变量的特点,提出来C4.5算法:
7、决策树的一个例子ID3 algorithm(dataset:是否要购买电脑)+如何画决策树
# -*- coding: utf-8 -*- #
"""
-------------------------------------------------------------------------------
  FileName:    decision_tree_ID3
  Author:      newlinfeng
  Date:        2020/8/3 0003  10:17
  Description: 使用是否购买电脑的数据集,来构建一个决策树例子(ID3)
-------------------------------------------------------------------------------
"""
from sklearn.feature_extraction import DictVectorizer
from sklearn import tree
from sklearn import preprocessing
import csv

#读入数据
Dtree = open(r'AllElectronics.csv', 'r')
#这次不是使用numpy来读(如果都是数字,可以使用这种方式来读,但现在这个csv里面都是字符,需要使用csv来读取),而是使用csv来读
reader = csv.reader(Dtree)

#获取第一行数据
#__next__():读取文件里面的第一行
headers = reader.__next__()
print(headers)

#定义两个列表
featureList = [] #保存特征的
labelList = [] #保存标签的


for row in reader: #每次从reader里面读取一行
    #把label存入list
    labelList.append(row[-1]) #拿到每一行的最后一列的数据存入标签的list中
    rowDict = {} #定义了一个空的字典
    for i in range(1, len(row)-1): #某一行的每一列(除第一行,最后一列以外)对应元素遍历,存入rowDict中
        #建立一个数据字典
        rowDict[headers[i]] = row[i]
    #把数据字典存入list
    featureList.append(rowDict) #再将每个rowDict保存到特征list

print('特征List初始化后的值:', featureList)
print('标签List初始化后的值:', labelList)


#由于算法无法使用字符来进行计算和分析,只能使用数字,所以需要将上面的数据进行转化
vec = DictVectorizer() #这个DictVectorizer类主要是将字典结构的字符转换为数字形式
x_data = vec.fit_transform(featureList).toarray()
print('featureList数字化转换成x_data: ' + str(x_data))

#打印属性名称
print(vec.get_feature_names())
#打印标签list
print("labelList:"+str(labelList))

#把标签转换成01表示
lb = preprocessing.LabelBinarizer()
y_data = lb.fit_transform(labelList)
print("labelList转换后的y_data:"+str(y_data) )


#创建一个决策树模型
# DecisionTreeClassifier:决策树分类器;criterion属性表示使用不同的算法,默认是gini的方式,这里是entropy是信息熵的方式
model = tree.DecisionTreeClassifier(criterion='entropy')
#输入数据建立模型
model.fit(x_data, y_data)

#测试
x_test = x_data[0] #选取x_data中的第0行元素
print("x_test:", str(x_test))

#reshape() 把x_test从一维数据变成二维数据
predict = model.predict(x_test.reshape(1, -1))
print("predict:"+str(predict))

'''
导出决策树
@todo:
1.pip install graphviz
2.http://www.graphviz.org
'''
import graphviz #http://www.graphviz.org

dot_data = tree.export_graphviz(model,
                                out_file=None,
                                feature_names=vec.get_feature_names(),
                                class_names=lb.classes_,
                                filled=True,
                                rounded=True,
                                special_characters=True)
graph = graphviz.Source(dot_data)
graph.render('computer')
(1) 这里需要注意,在第一次安装完毕graphviz之后,需要讲Pycharm重启一下,否则画图会报如下错误:
graphviz.backend.ExecutableNotFound: failed to execute ['dot', '-Tpdf', '-O', 'cart'], make sure the Graphviz executables are on your systems' PATH最终决策树的pdf文件为:
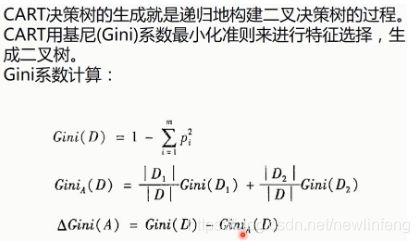
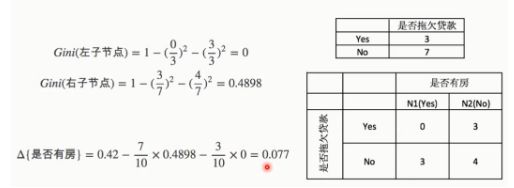
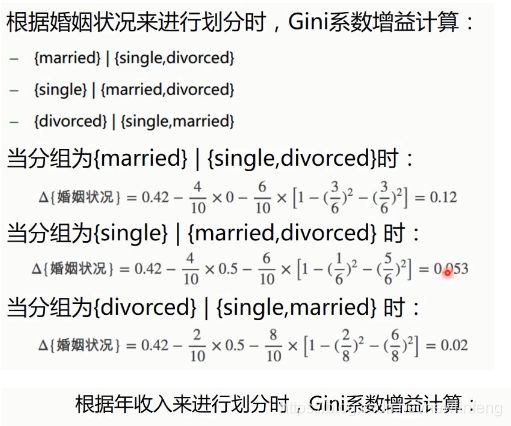
7、CART算法
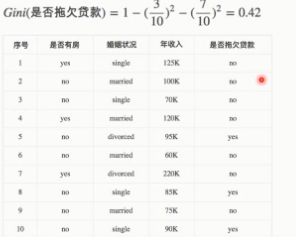
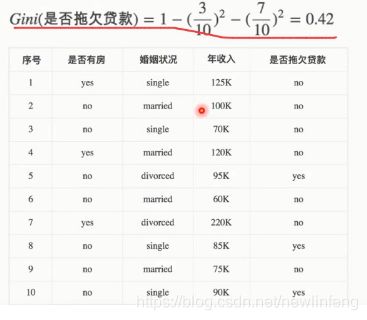
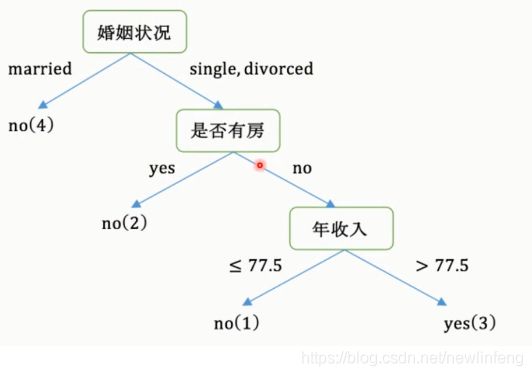
7.1 CART算法举例
第一步:
第二步:
最后构建的CART:
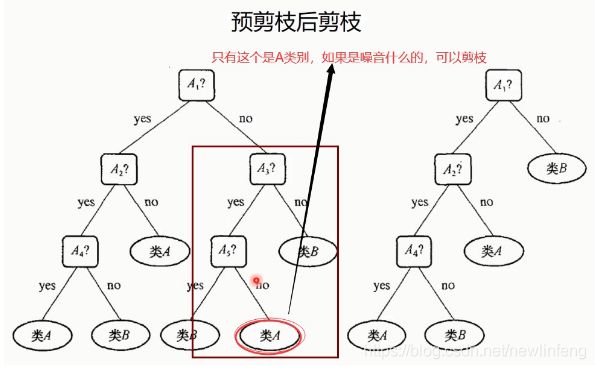
8、抵抗决策树的过拟合问题:决策树的剪枝
9、决策树的优缺点
10、使用CART算法来实现决策树的一个问题
# -*- coding: utf-8 -*- #
"""
-------------------------------------------------------------------------------
  FileName:    decision_tree_CART
  Author:      newlinfeng
  Date:        2020/8/3 0003  22:22
  Description: 使用CART算法实现决策树的例子
-------------------------------------------------------------------------------
"""
from sklearn import tree
import numpy as np

#载入数据
data = np.genfromtxt("cart.csv", delimiter=",")
x_data = data[1:, 1:-1]
y_data = data[1:, -1]

#创建决策树模型
model = tree.DecisionTreeClassifier()
#输入数据建立模型
model.fit(x_data, y_data)

#导出决策树
import graphviz
dot_data = tree.export_graphviz(model,
                                out_file=None,
                                feature_names=['house_yes', 'house_no', 'single', 'married', 'divorced', 'income'],
                                class_names=['no', 'yes'],
                                filled=True,
                                rounded=True,
                                special_characters=True)
graph = graphviz.Source(dot_data)
graph.render('cart')
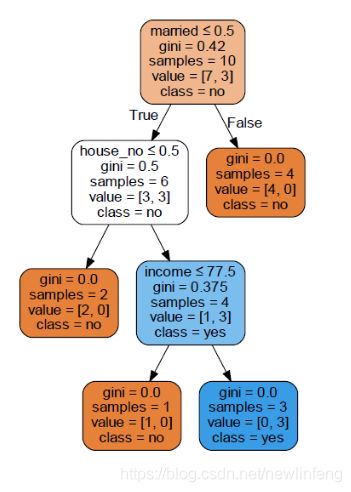
得到的decision tree的PDF:
11、决策树-线性二分类(linear dichotomy)
# -*- coding: utf-8 -*- #
"""
-------------------------------------------------------------------------------
  FileName:    linear_dichotomy
  Author:      newlinfeng
  Date:        2020/8/4 0004  9:05
  Description: 使用决策树解决线性二分类的问题
-------------------------------------------------------------------------------
"""
import matplotlib.pyplot as plt
import numpy as np
from sklearn.metrics import classification_report
from sklearn import tree

#载入数据
data = np.genfromtxt("LR-testSet.csv", delimiter=',')
x_data = data[:, :-1]
y_data = data[:, -1]

plt.scatter(x_data[:, 0], x_data[:, 1], c=y_data)
plt.show()


#创建决策树模型
model = tree.DecisionTreeClassifier()
#输入数据建立模型
model.fit(x_data, y_data)

#导出决策树
import graphviz
dot_data = tree.export_graphviz(model,
                                out_file=None,
                                feature_names=['x', 'y'],
                                class_names=['label0', 'label1'],
                                filled=True,
                                rounded=True,
                                special_characters=True)
graph = graphviz.Source(dot_data)


#输入数据建立模型
model.fit(x_data, y_data)

#获取数据值所在的范围
x_min, x_max = x_data[:, 0].min() - 1, x_data[:, 0].max()+1
y_min, y_max = x_data[:, 1].min() - 1, x_data[:, 1].max()+1

#生成网络矩阵
xx, yy = np.meshgrid(np.arange(x_min, y_max, 0.02),
                     np.arange(y_min, y_max, 0.02))
#ravel与flatten类似,多维数组转一维。flatten不会改变原始数据,ravel会改变原始数据
z = model.predict(np.c_[xx.ravel(), yy.ravel()])
z = z.reshape(xx.shape)
#等高线图
cs = plt.contourf(xx, yy, z)
#样本散点图
plt.scatter(x_data[:, 0], x_data[:, 1], c=y_data)
plt.show()


predictions = model.predict(x_data)
print(classification_report(predictions,y_data))
12、决策树-非线性二分类(non-linear dichotomy)/出现了过拟合
# -*- coding: utf-8 -*- #
"""
-------------------------------------------------------------------------------
  FileName:    non-linear_dichotomy
  Author:      newlinfeng
  Date:        2020/8/5 0005  15:16
  Description: 使用决策树解决非线性二分类
-------------------------------------------------------------------------------
"""
import matplotlib.pyplot as plt
import numpy as np
from sklearn.metrics import classification_report
from sklearn import tree
from sklearn.model_selection import train_test_split

#载入数据
data = np.genfromtxt("LR-testSet2.txt", delimiter=',')
x_data = data[:, :-1]
y_data = data[:, -1]

plt.scatter(x_data[:, 0], x_data[:, 1], c=y_data)
plt.show()


#分割数据,默认情况下是3/4是训练集和训练集标签;1/4是测试集和测试集标签
x_train, x_test, y_train, y_test = train_test_split(x_data, y_data)

#创建决策树模型
#max_depth, 树的深度
#min_samples_split 内部节点再划分所需要最小样本数
model = tree.DecisionTreeClassifier()
#输入数据建立模型
model.fit(x_train, y_train)

#导出决策树
import graphviz

dot_data = tree.export_graphviz(model,
                                out_file=None,
                                feature_names= ['x', 'y'],
                                class_names = ['label0', 'label1'],
                                filled=True,
                                rounded = True,
                                special_characters=True)
graph = graphviz.Source(dot_data)
# graph.render('non-linear_dichotomy') #决策树导出为pdf


#获取数据值所在的范围
x_min, x_max = x_data[:, 0].min() - 1, x_data[:, 0].max()+1
y_min, y_max = x_data[:, 1].min() - 1, x_data[:, 1].max()+1

#生成网络矩阵
xx, yy = np.meshgrid(np.arange(x_min, y_max, 0.02),
                     np.arange(y_min, y_max, 0.02))
#ravel与flatten类似,多维数组转一维。flatten不会改变原始数据,ravel会改变原始数据
z = model.predict(np.c_[xx.ravel(), yy.ravel()])
z = z.reshape(xx.shape)
#等高线图
cs = plt.contourf(xx, yy, z)
#样本散点图
plt.scatter(x_data[:, 0], x_data[:, 1], c=y_data)
plt.show()


#使用训练集预测效果非常好,几个标准都为1
predictions = model.predict(x_train)
print(classification_report(predictions,y_train))

#使用训练集预测效果非常差,几个标准都为只有50%
predictions = model.predict(x_test)
print(classification_report(predictions,y_test))
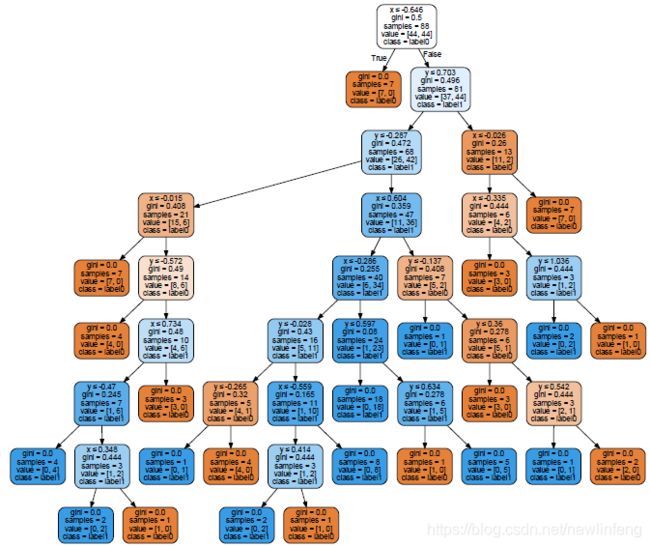
决策树导出为PDF展示,结构较为复杂:
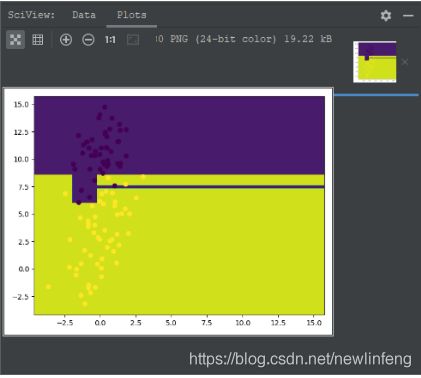
描述的决策边界:
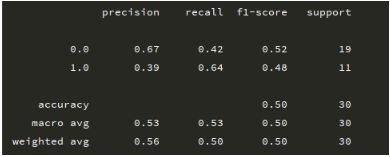
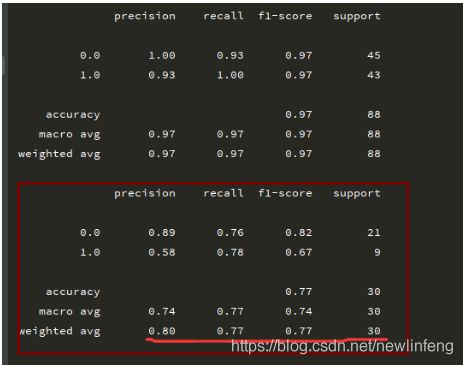
最终结果却出现了过拟合:即:训练集中很好,测试集中表现很差,如下图:
训练集进行预测,很好:
测试集进行预测,很差:
12.1 使用剪枝来抵抗过拟合
剪枝的方式如下:
(1) 在DecisionTreeClassifier()方法中设置树的深度max_depth
(2) 在DecisionTreeClassifier()方法中设置树的内部节点再划分所需要最小样本数min_samples_split
经过上述的两个参数的修改,可以将评分从50%提高到80%左右,和之前使用逻辑回归得到的评价差不多:
2020-08-10 更新

