Vue中使用Echarts的两种方式
【1】方法1:require引入js文件,注意路径问题
let echarts=require('../../../static/js/echarts4.0.4.min.js');【2】echart代码
drawScatterChart: function() {
let scatterChart = echarts.init(document.querySelector('.results53-echart'));
let textStyle2 = {
color: '#888',
fontStyle: 'normal',
fontWeight: 'normal',
fontFamily: 'sans-serif',
fontSize: 14,
};
let textStyle = {
color: 'white',
fontStyle: 'normal',
fontWeight: 'normal',
fontFamily: 'sans-serif',
fontSize: 14,
};
let scatterChart_option = {
title: [
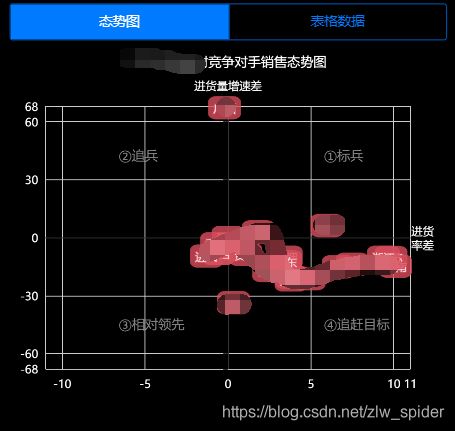
{text: this.indname+"相对竞争对手销售态势图", x: 'center', y: 0,
textStyle: textStyle },
{text: "①标兵", x: '70%', y: '25%', textStyle: textStyle2 },
{text: "②追兵", x: '25%', y: '25%', textStyle: textStyle2 },
{text: "③相对领先", x: '25%', y: '70%', textStyle: textStyle2 },
{text: "④追赶目标", x: '70%', y: '70%', textStyle: textStyle2 }
],
dataZoom:[
{type:'inside',yAxisIndex: 0},
{type:'inside',xAxisIndex: 0}
],
tooltip : {
trigger: 'item',
axisPointer:{
type : 'cross',
},
formatter:function(params){
return "【"+params.data[3]+"】"
+"
同" + this.indname + "进货率差:"+(params.data[0] ? params.data[0]: '-') + '%'
+"
同" + this.indname + "进货量增速差:"+(params.data[1] ? params.data[1]: '-') + "%";
}
},
toolbox: {
show : true,
feature : {
}
},
xAxis : [
{
type : 'value',
name:'进货\n率差',
nameTextStyle: {color: 'white',padding:-14},
axisLabel: {
color: 'white',
formatter:function (value, index){
let texts = value;
if(value>10000||value<-10000){
texts = parseInt(value/10000)+'万'
}
return texts;
}},
axisTick: {
show: false
},
}
],
yAxis : [
{
type : 'value',
axisLable: {
show: true,
formatter:'{value} %'
},
name:'进货量增速差',
nameTextStyle: {color: 'white'},
axisLabel: {
color: 'white',
formatter:function (value, index){
let texts = value;
if(value>10000||value<-10000){
texts = parseInt(value/10000)+'万'
}
return texts;
}},
axisTick: {
show: true
},
}
],
series : [
{
name: "销售态势",
type:'scatter',
data:[],
symbol:'roundRect',
symbolSize: [35, 25],
itemStyle:{
normal: {
color: '#d94e5d',
},
emphasis: {
color: 'blue',
}
},
label: {
normal: {
show: true,
position: 'inside',
formatter: function (params) {
return params.data[2]
},
textStyle: {
fontSize: 12,
}
}
}
}
]
};
let rangeCode = this.rangeCode;
let data = [];
let maxX=0, maxY=0;
let grid = this.$refs.results53_grid.grid;;
let indNameColIndex = grid.getColNumber(1, 'name');
let rangeCodeColIndex = grid.getColNumber(0, 'rangecode');
let qtyDiffColIndex = grid.getColNumber(0, 'buy_ratio_diff');
let qtyRatioDiffColIndex = grid.getColNumber(0, 'buy_qty_diff');
$(grid.getTable()).find('tr').each(function(i) {
let fixedRow = $(grid.getTable('31')).find('tr').eq(i);
if($(this).find('td').eq(rangeCodeColIndex).text() == rangeCode) {
$(this).show();
fixedRow.show();
let indName = fixedRow.find('td').eq(indNameColIndex).text();
if(indName == '合计') {
return true;
}
let qtyDiff = parseFloat($(this).find('td').eq(qtyDiffColIndex).text() || '0');
maxX = Math.max(Math.abs(qtyDiff), maxX);
let qtyRatioDiff = parseFloat($(this).find('td').eq(qtyRatioDiffColIndex).text() || '0');
maxY = Math.max(Math.abs(qtyRatioDiff), maxY);
data.push([qtyDiff, qtyRatioDiff, indName.substr(0,2), indName]);
} else {
$(this).hide();
fixedRow.hide();
}
});
maxX = Math.ceil(maxX);
maxY = Math.ceil(maxY);
if(data.length == 0) {
scatterChart.clear();
$('.results5-text').hide();
return ;
}
scatterChart_option.series[0].data = data;
scatterChart_option.xAxis[0].min = -maxX;
scatterChart_option.xAxis[0].max = maxX;
scatterChart_option.yAxis[0].min = -maxY;
scatterChart_option.yAxis[0].max = maxY;
scatterChart.setOption(scatterChart_option, true);
}【3】实现效果
【4】方法2:npm install echarts -S 安装echarts
(1)npm install echarts -S 安装

(2)在main.js里面添加,将echarts设置为全局变量
   import echarts from 'echarts'
   Vue.prototype.$echarts = echarts

(3)vue中使用echarts
   let scatterChart = this.$echarts.init(document.querySelector('.res-echart'));
这两种方式都可达到目的