基于规则嵌入的论文比对系统——创新实训记录7
6-18 不同年份论文集上的数据可视化补充+不同会议论文集上的一点数据可视化
创新实训记录7
- 不同年份论文集上的数据可视化补充
- 不同会议论文集上的一点数据可视化
- 数据预处理
- 可视化
不同年份论文集上的数据可视化补充
昨天是统计了每一个年份对应的论文总数,现在想要统计一个年份区间内的论文数,以饼状图的形式展示数据,可以更为直观地看到数据之间的比例关系。
我们就以10年为一个区间,通过前期观察发现ACM数据集中1950年之前的论文非常少,所以将1900-1949单独归为一个年份区间。
# 可视化:不同年份区间的论文数量(饼状图),10年为一个时间段
from pyecharts import options as opts
from pyecharts.charts import Pie
from pyecharts.globals import ThemeType

# 年份区间
use_y = ['1900-1949','1950-1959',
           '1960-1969','1970-1979',
           '1980-1989','1990-1999',
           '2000-2009','2010-2020']

#年分区间对应的论文数
use_x = [0,0,0,0,0,0,0,0]

for k in sorted(years_dic):
    if 1900<int(k)<1950:
        use_x[0] += years_dic[k]
    elif 1949<int(k)<1960:
        use_x[1] += years_dic[k]
    elif 1959<int(k)<1970:
        use_x[2] += years_dic[k]
    elif 1959<int(k)<1970:
        use_x[2] += years_dic[k]
    elif 1969<int(k)<1980:
        use_x[3] += years_dic[k]
    elif 1979<int(k)<1990:
        use_x[4] += years_dic[k]
    elif 1989<int(k)<2000:
        use_x[5] += years_dic[k]
    elif 1999<int(k)<2010:
        use_x[6] += years_dic[k]
    else:
        use_x[7] += years_dic[k]

print(use_x)

#绘制饼图
year_pie=Pie()\
    .add("年分区间", [list(z) for z in zip(use_y, use_x)],
        label_opts=opts.LabelOpts(is_show=True),
        center=["40%", "40%"],
        radius=[40, 120])\
    .set_colors(["blue", "green", "yellow", "red", "pink", "orange", "purple","grey"])\
    .set_global_opts(title_opts=opts.TitleOpts(
                               title="不同年份区间的论文数量",),
                    legend_opts=opts.LegendOpts(is_show=False))\
    .set_series_opts(tooltip_opts=opts.TooltipOpts(
             formatter="{a}
{b}: {c} ({d}%)"
        ))
year_pie.render_notebook()
通过下图可以发现,我们的论文数据主要来源于2000-2009年,占了总数据的70.89%,其次是1990-1999年之间的论文,占了总量的1/5左右。

不同会议论文集上的一点数据可视化
思路:先统计每个会议对应的论文总数,然后进行筛选,只保留总数比较大的(比如大于50)进行数据展示。展示来自不同会议的论文数(饼状图)。
数据预处理
爬完数据之后没有进行进一步的处理,今天打开venues.txt后发现有很多格式不对的数据,如:


应该是因为有一些会议或者期刊名字比较长,在被爬取的网页上只展示了部分信息,后面就用省略号或者别的符号代替了。所以我们需要先对venue进行字符串处理,去除掉奇怪的符号。只保留字母、数字和一些正常的标点符号。
# 对venues.txt进行进一步处理
import re

file_venues = 'D:/大学资料/大三下/项目实训/code+data/ACM数据集/venues.txt'
fvenues = open(file_venues,'r')

file_new = 'D:/大学资料/大三下/项目实训/code+data/ACM数据集/newvenues.txt'
fnew = open(file_new,'w')

for line in fvenues:
    venue = line.strip()
    result =re.sub(r'[^A-Za-z\,\.\&\(\)\0-9\:]','', venue)+'\n'
    fnew.write(result)

fvenues.close()
fnew.close()

print('数据写入完毕')
读取venues.txt,将不同会议对应的论文数放入一个字典。
# 读取venues.txt,将不同会议对应的论文数放入一个字典
import json

file_venues = 'D:/大学资料/大三下/项目实训/code+data/ACM数据集/venues.txt'
fvenues = open(file_venues,'r')
venues_dic = { }
for line in fvenues:
    venue = line.strip()
    if venue in venues_dic.keys() and venue is not '':
        venues_dic[venue]+=1
    elif venue is not '':
        temp = {}
        temp[venue] = 1
        venues_dic.update(temp)
    else:
        continue
print(len(venues_dic))
print(venues_dic)

fvenues.close()
venue_count = 'D:/大学资料/大三下/项目实训/code+data/ACM数据集/venue_count.json'
fcount = open(venue_count, 'w')

for k,v in  venues_dic.items():
    temp = {}
    temp[k]=v
    json.dump(temp, fcount)
    fcount.write('\n')

fcount.close()
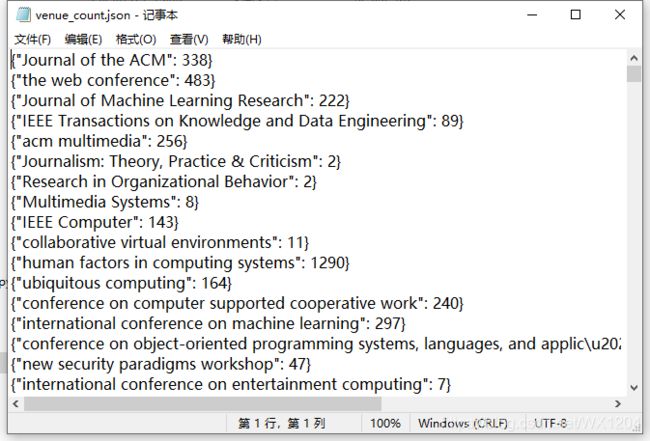
Json文件的形式:

在进行数据筛选前,我们看到论文的会议/期刊数有3024个,可见我们的数据来源具有多样性的特点。
对数据进行筛选,选出论文总数大于50的会议。
# 保留原始的字典,新建一个符合条件的会议字典
use_dic = {}
for k in venues_dic:
    if venues_dic[k]>50:
        temp = {}
        temp[k]=venues_dic[k]
        use_dic.update(temp)

print(len(use_dic))
print(use_dic)
可视化
# 数据可视化,绘制饼状图

# 构造x,y数据
x_data = []
y_data = []
for k,v in use_dic.items():
    x_data.append(k)
    y_data.append(v)
print(y_data)

from pyecharts import options as opts
from pyecharts.charts import Pie
from pyecharts.globals import ThemeType

#绘制饼图
venue_pie=Pie()\
    .add("会议/期刊", [list(z) for z in zip(x_data, y_data)],
        label_opts=opts.LabelOpts(is_show=False),
        radius=[40, 120])\
    .set_colors(["blue", "green", "yellow", "red", "pink", "orange", "purple","grey"])\
    .set_global_opts(title_opts=opts.TitleOpts(
                               title="不同会议/期刊(论文总数大于50)的论文数量分布",),
                    legend_opts=opts.LegendOpts(is_show=False))\
    .set_series_opts(tooltip_opts=opts.TooltipOpts(
             formatter="{a}
{b}: {c} ({d}%)"
        ),)
venue_pie.render_notebook()
从下图可以看到,我们的论文来自非常多不同的会议、期刊,其中包含论文比较多的会议、期刊有human fators in computing systems、Communications of The ACM、international conference on management of data、Journal of the ACM等。

