Angular 整合 Echarts
如果你还不懂如何在angular中使用echarts,可以参考本文。
安装npm,通过angular-cli创建一个angular项目,这是你需要的前置工作。
本文使用版本
Echarts : 4.2.1
ngx-echarts : 4.2.1
Angular : 7.0.0
安装Module
npm install echarts --save
npm install ngx-echarts --save
以上分别安装了“echarts”和 “angular整合echarts”的依赖。
创建echarts demo component
ng g c echarts-demo
代码示例
1.在app.module.ts 中引入依赖ngx-echarts 和 echarts-demo.component
import { BrowserModule } from '@angular/platform-browser';
import { NgModule } from '@angular/core';
import { HttpClientModule } from '@angular/common/http';
import { AppRoutingModule } from './app-routing.module';
import { AppComponent } from './app.component';
import { EchartsDemoComponent } from './echarts-demo/echarts-demo.component';
import { NgxEchartsModule } from 'ngx-echarts';

@NgModule({
  declarations: [
    AppComponent,
    EchartsDemoComponent
  ],
  imports: [
    BrowserModule,
    AppRoutingModule,
    NgxEchartsModule,
    HttpClientModule
  ],
  providers: [],
  bootstrap: [AppComponent]
})
export class AppModule { }
2.在echarts-demo.component.html中添加div元素作为echarts容器
3. 在echarts-demo.components.ts 中构建echarts的option
import { Component, OnInit } from '@angular/core';
import { HttpClient } from '@angular/common/http';
import { LoadingService } from '../loading.service'

@Component({
  selector: 'app-echarts-demo',
  templateUrl: './echarts-demo.component.html',
  styleUrls: ['./echarts-demo.component.css']
})
export class EchartsDemoComponent implements OnInit {

  barOption = {
    title: {
      text: '懒猫今日访问量'
    },
    legend: {
      data: ['邮件营销', '联盟广告', '视频广告', '直接访问', '搜索引擎']
    },
    color: ['#3398DB'],
    //气泡提示框,常用于展现更详细的数据
    tooltip: {
      trigger: 'axis',
      axisPointer: { // 坐标轴指示器,坐标轴触发有效
        type: 'shadow' // 默认为直线,可选为:'line' | 'shadow'
      }
    },
    grid: {
      top:'100px',
      containLabel: false
    },
    xAxis: [{
      name: "访问来源",
      type: 'category',
      data: ['邮件营销', '联盟广告', '视频广告', '直接访问', '搜索引擎'],
      axisTick: {
        alignWithLabel: true
      },
      axisLabel: {
        interval: 0,
        rotate: 20
      },
    }],
    yAxis: [{
      name: "访问量",
      type: 'value'
    }],
    series: [{
      name: '今日访问次数',
      type: 'bar',
      label: {
        normal: {
          show: true,
          position:'top'
        }
      },
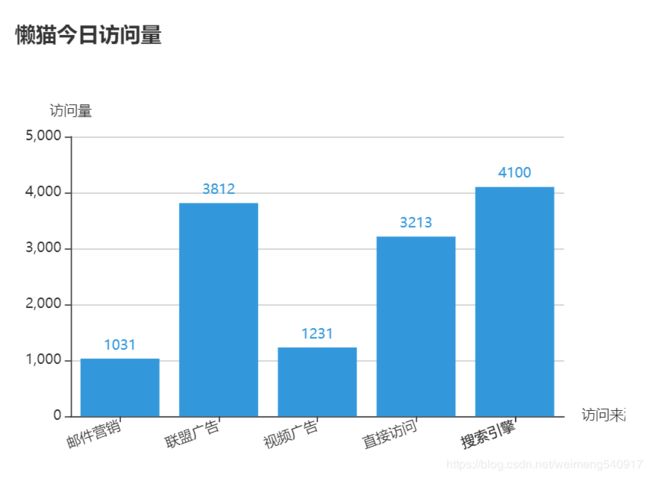
      data: [1031, 3812, 1231, 3213,4100],
    }]
  }

}
4.效果
