Prometheus学习笔记(一)Prometheus v2.16.0环境搭建
文章目录
- 一、主机准备
- 二、参考文档
- 三、环境配置
- 3.1 配置阿里YUM源、安装基本工具
- 3.2 关闭防火墙、Selinux
- 3.3 修改主机名
- 3.4 配置时间同步
- 四、安装prometheus服务端
- 五、安装node_exporter
一、主机准备
操作系统
[root@localhost ~]# cat /etc/redhat-release
CentOS Linux release 7.6.1810 (Core)
| 主机名 | IP | 角色 |
|---|---|---|
| prometheus.server | 192.168.1.180 | prometheus服务端 |
| grafana.server | 192.168.1.181 | grafana服务端 |
| nginx1.server | 192.168.1.182 | 被监控主机 |
| nginx2.server | 192.168.1.183 | 被监控主机 |
二、参考文档
官方文档
官方下载地址
三、环境配置
所有主机配置标准化环境
3.1 配置阿里YUM源、安装基本工具
yum install -y wget \
&& mkdir -p /etc/yum.repos.d/repo_bak \
&& mv /etc/yum.repos.d/*.repo /etc/yum.repos.d/repo_bak/ \
&& wget -O /etc/yum.repos.d/CentOS-Base.repo http://mirrors.aliyun.com/repo/Centos-7.repo \
&& wget -O /etc/yum.repos.d/epel.repo http://mirrors.aliyun.com/repo/epel-7.repo \
&& yum install -y vim net-tools lrzsz ntp unzip \
&& yum makecache && yum clean all
3.2 关闭防火墙、Selinux
# 关闭防火墙
systemctl stop firewalld && systemctl disable firewalld
# 关闭Selinux
setenforce 0 && sed -i 's/SELINUX=enforcing/SELINUX=disabled/g' /etc/selinux/config
3.3 修改主机名
# prometheus.server
hostnamectl set-hostname prometheus.server && echo "192.168.1.180 prometheus.server" >> /etc/hosts
# grafana.server
hostnamectl set-hostname grafana.server && echo "192.168.1.181 grafana.server" >> /etc/hosts
# nginx1.server
hostnamectl set-hostname nginx1.server && echo "192.168.1.182 nginx1.server" >> /etc/hosts
# nginx2.server
hostnamectl set-hostname nginx2.server && echo "192.168.1.183 nginx2.server" >> /etc/hosts
3.4 配置时间同步
关闭chrony服务
systemctl stop chronyd && systemctl disable chronyd
设置NTP服务
vim /etc/ntp.conf
# 将时钟服务器更改为如下4个
server 0.cn.pool.ntp.org
server 1.cn.pool.ntp.org
server 2.cn.pool.ntp.org
server 3.cn.pool.ntp.org
启动时间同步服务器
systemctl start ntpd \
&& systemctl enable ntpd \
&& ntpdate -u 0.cn.pool.ntp.org \
&& hwclock --systohc \
&& date
四、安装prometheus服务端
下载 prometheus-2.16.0.linux-amd64.tar.gz(迅雷下载会快一点)
将下载的包上传到服务器上,解压,启动prometheus可执行文件
tar -zxvf prometheus-2.16.0.linux-amd64.tar.gz
cd prometheus-2.16.0.linux-amd64
./prometheus --config.file="prometheus.yml" --web.listen-address=:9090 --web.enable-lifecycle &
| 参数 | 解释 |
|---|---|
--config.file |
指定配置文件 |
--web.listen-address |
指定浏览器访问端口 |
--web.enable-lifecycle |
开启配置热加载 |
看到最后一行提示
level=info ts=2020-03-26T02:51:26.026Z caller=main.go:630 msg="Server is ready to receive web requests."
进入浏览器输入IP:9090,Status→Targets就会看到已经在监控自己的主机
五、安装node_exporter
每台被监控的主机都要安装node_exporter
下载 node_exporter-0.18.1.linux-amd64.tar.gz(迅雷下载会快一点)
将下载的包上传到服务器上,解压,启动node_exporter可执行文件
tar -zxvf node_exporter-0.18.1.linux-amd64.tar.gz
cd node_exporter-0.18.1.linux-amd64
./node_exporter &
看到最后一行提示
INFO[0000] Listening on :9100 source="node_exporter.go:170"
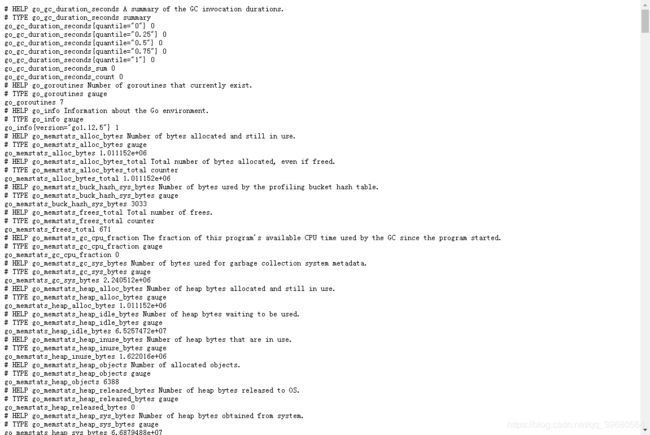
进入浏览器输入IP:9100/metrics,就可以看到已经采集的指标
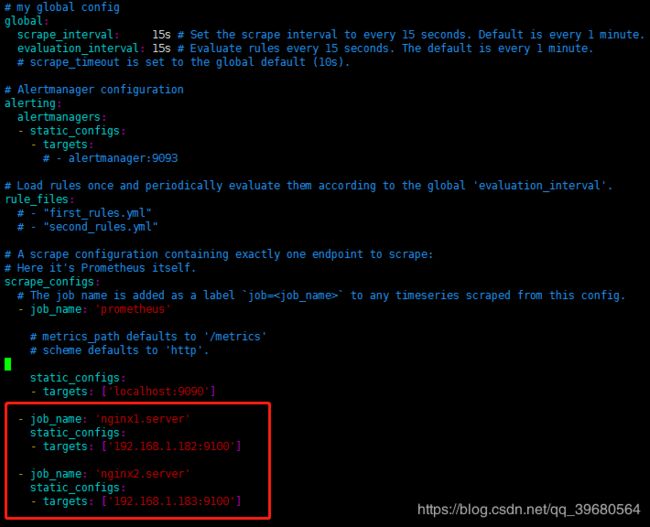
修改prometheus服务端的配置文件,添加被监控主机
vim prometheus.yml
添加两台被监控的主机信息
  - job_name: 'nginx1.server'
    static_configs:
    - targets: ['192.168.1.182:9100']

  - job_name: 'nginx2.server'
    static_configs:
    - targets: ['192.168.1.183:9100']
如图
热加载prometheus配置
curl -XPOST 127.0.0.1:9090/-/reload
提示
level=info ts=2020-04-07T09:23:46.873Z caller=main.go:747 msg="Loading configuration file" filename=prometheus.yml
level=info ts=2020-04-07T09:23:46.873Z caller=main.go:775 msg="Completed loading of configuration file" filename=prometheus.yml
再次查看监控列表,这两台主机已经被监控了。
