微信小程序antv使用详解
1.配置项目
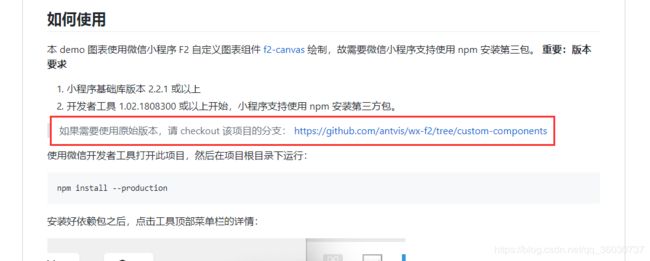
到github上把项目下载下来,我的微信开发版本没有更新,用的是旧版本,新版本地址
2.目录结构
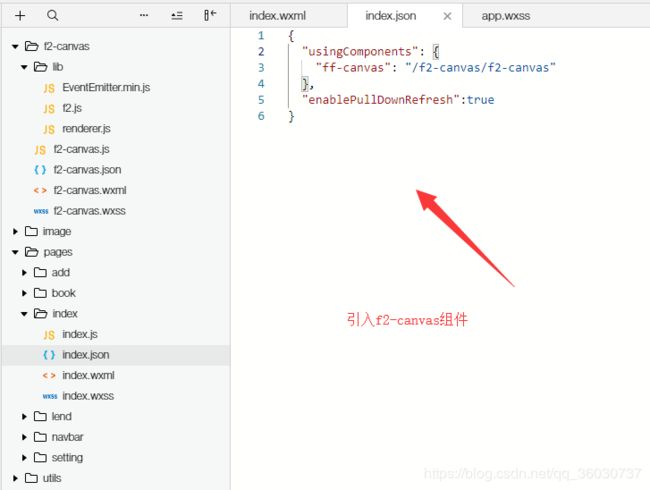
按时github上的提示,配置出来项目是这样的
3.使用图例
假设我们要使用这种图例样式,在antv-f2 demo里找的一个,把右边的代码中,script标签里的代码复制过来
index.json
{
  "usingComponents": {
    "ff-canvas": "/f2-canvas/f2-canvas"
  },
  "enablePullDownRefresh":true
}
index.wxml
index.wxss
.chart_cont{
  width:100%;
  height: 500rpx;
}
index.js
import F2 from '../../f2-canvas/lib/f2';
//获取应用实例
const app = getApp()
Page({

  data: {
  },

  onLoad() {
    this.lineChart();
  },

  /**
   * 折线图
   */
  lineChart() {
    /**动态交互时,通过调用传入新的data值*/
    var data = [{ time: '2016-08-08 00:00:00', value: 10, type: '预期收益率' },
    {
      time: '2016-08-08 00:10:00',
      value: 22,
      type: '预期收益率'
    }, {
      time: '2016-08-08 00:30:00',
      value: 16,
      type: '预期收益率'
    }, {
      time: '2016-08-09 00:35:00',
      value: 26,
      type: '预期收益率'
    }, {
      time: '2016-08-09 01:00:00',
      value: 12,
      type: '预期收益率'
    }, {
      time: '2016-08-09 01:20:00',
      value: 26,
      type: '预期收益率'
    }, {
      time: '2016-08-10 01:40:00',
      value: 18,
      type: '预期收益率'
    }, {
      time: '2016-08-10 02:00:00',
      value: 26,
      type: '预期收益率'
    }, {
      time: '2016-08-10 02:20:00',
      value: 12,
      type: '预期收益率'
    }, {
      time: '2016-08-08 00:00:00',
      value: 4,
      type: '实际收益率'
    }, {
      time: '2016-08-08 00:10:00',
      value: 3,
      type: '实际收益率'
    }, {
      time: '2016-08-08 00:30:00',
      value: 6,
      type: '实际收益率'
    }, {
      time: '2016-08-09 00:35:00',
      value: -12,
      type: '实际收益率'
    }, {
      time: '2016-08-09 01:00:00',
      value: 1,
      type: '实际收益率'
    }, {
      time: '2016-08-09 01:20:00',
      value: 9,
      type: '实际收益率'
    }, {
      time: '2016-08-10 01:40:00',
      value: 13,
      type: '实际收益率'
    }, {
      time: '2016-08-10 02:00:00',
      value: -3,
      type: '实际收益率'
    }, {
      time: '2016-08-10 02:20:00',
      value: 11,
      type: '实际收益率'
    }];
    var that = this;
    /*在这里改变一下结构即可*/
    that.chartComponent = that.selectComponent('#borkenLine');
    that.chartComponent.init((canvas, width, height) => {
      const chart = new F2.Chart({
        el: canvas,
        width,
        height,
        animate: false
      });
      chart.source(data, {
        time: {
          type: 'timeCat',
          tickCount: 3,
          mask: 'hh:mm',
          range: [0, 1]
        },
        value: {
          tickCount: 3,
          formatter: function formatter(ivalue) {
            return ivalue + '%';
          }
        }
      });
      chart.axis('time', {
        line: null,
        label: function label(text, index, total) {
          var textCfg = {};
          if (index === 0) {
            textCfg.textAlign = 'left';
          } else if (index === total - 1) {
            textCfg.textAlign = 'right';
          }
          return textCfg;
        }
      });
      chart.axis('tem', {
        grid: function grid(text) {
          if (text === '0%') {
            return {
              lineDash: null,
              lineWidth: 1
            };
          }
        }
      });
      chart.legend({
        position: 'bottom',
        offsetY: -5
      });
      chart.line().position('time*value').color('type').shape('type', function (type) {
        if (type === '预期收益率') {
          return 'line';
        }
        if (type === '实际收益率') {
          return 'dash';
        }
      });

      chart.render();
    })
  }

})
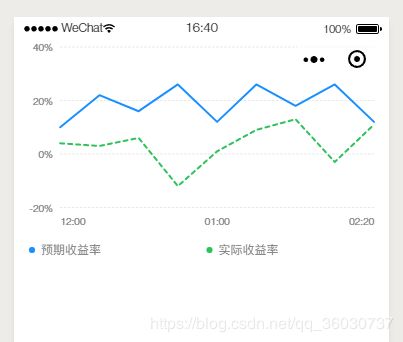
效果:(更多详细使用,要看文档了~)


