SpringBoot之Vue添加图表
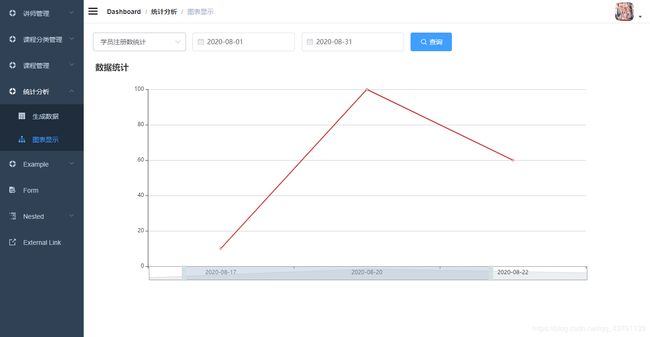
SpringBoot之统计后台注册人数的图表
本文章只是提到这个工具的基本使用,并没有后端调用数据的方法,需要自己写
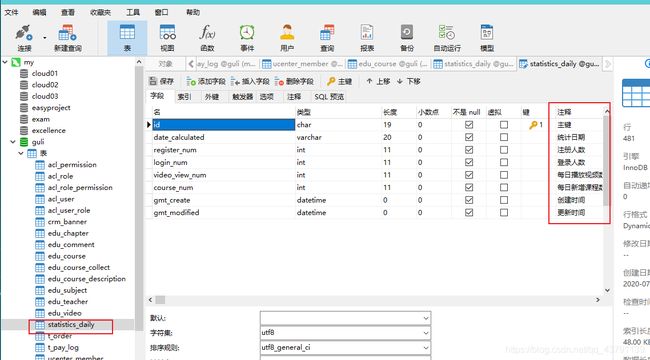
1.创建统计图表的数据库
2.后台需要查找截至前一天的统计数据,不是今天,然后加到上面这种表里面。所以设置定时任务,每天凌晨执行,下图是结构和一个工具类。工具类里面是查找前一天的日期
工具类DateUtil
import java.text.SimpleDateFormat;
import java.util.Calendar;
import java.util.Date;

/**
 * 日期操作工具类
 *
 * @author qy
 * @since 1.0
 */
public class DateUtil {

    private static final String dateFormat = "yyyy-MM-dd";

    /**
     * 格式化日期
     *
     * @param date
     * @return
     */
    public static String formatDate(Date date) {
        SimpleDateFormat sdf = new SimpleDateFormat(dateFormat);
        return sdf.format(date);

    }

    /**
     * 在日期date上增加amount天 。
     *
     * @param date   处理的日期,非null
     * @param amount 要加的天数,可能为负数
     */
    public static Date addDays(Date date, int amount) {
        Calendar now =Calendar.getInstance();
        now.setTime(date);
        now.set(Calendar.DATE,now.get(Calendar.DATE)+amount);
        return now.getTime();
    }

    public static void main(String[] args) {
        System.out.println(DateUtil.formatDate(new Date()));
        System.out.println(DateUtil.formatDate(DateUtil.addDays(new Date(), -1)));
    }
}
定时器
定时器日期自动生成地址
import com.mine.guli.service.StatisticsDailyService;
import com.mine.guli.utils.DateUtil;
import org.springframework.beans.factory.annotation.Autowired;
import org.springframework.scheduling.annotation.Scheduled;
import org.springframework.stereotype.Component;

import java.util.Date;

//定时器
@Component
public class ScheduledTask {

    @Autowired
    private StatisticsDailyService staService;

    //在每天凌晨1点,把前一天的数据进行添加,执行方法,把数据查询进行添加
    @Scheduled(cron = "0 0 1 * * ?")
    public void task1(){
        staService.registerCount(DateUtil.formatDate(DateUtil.addDays(new Date(),-1)));
    }

}
3.Vue页面使用ECharts,下载依赖
官网地址
npm install --save [email protected]
4.整合页面
<template>
  <div class="app-container">
    <!--表单-->
    <el-form :inline="true" class="demo-form-inline">
      <el-form-item>
        <el-select v-model="searchObj.type" clearable placeholder="请选择">
          <el-option label="学员登录数统计" value="login_num"/>
          <el-option label="学员注册数统计" value="register_num"/>
          <el-option label="课程播放数统计" value="video_view_num"/>
          <el-option label="每日课程数统计" value="course_num"/>
        </el-select>
      </el-form-item>
      <el-form-item>
        <el-date-picker
          v-model="searchObj.begin"
          type="date"
          placeholder="选择开始日期"
          value-format="yyyy-MM-dd" />
      </el-form-item>
      <el-form-item>
        <el-date-picker
          v-model="searchObj.end"
          type="date"
          placeholder="选择截止日期"
          value-format="yyyy-MM-dd" />
      </el-form-item>
      <el-button
        :disabled="btnDisabled"
        type="primary"
        icon="el-icon-search"
        @click="showChart()">查询</el-button>
    </el-form>
    <div class="chart-container">
      <div id="chart" class="chart" style="height:500px;width:100%" />
    </div>
  </div>
</template>

<script>
  import echarts from 'echarts'
  import staApi from '@/api/sta'
  export default {
      data() {
        return {
          searchObj: {
            type: '',
            begin: '',
            end: ''
          },
          btnDisabled: false,
          chart: null,
          title: '',
          xData: [],
          yData: []
        }
      },
      methods: {
        showChart() {
          this.initChartData()
          this.setChart()
        },
        // 准备图表数据
        initChartData() {
          staApi.getDataSta(this.searchObj).then(response =>{
            this.xData = response.data.date_calculated
            this.yData = response.data.numDataList
          })
        },
        // 设置图标参数
        setChart() {
          // 基于准备好的dom,初始化echarts实例
          this.chart = echarts.init(document.getElementById('chart'))
          // console.log(this.chart)
          // 指定图表的配置项和数据
          var option = {
            // 标题
            title: {
              text: '数据统计'
            },
            tooltip: {
              trigger: 'axis'
            },
            // 区域缩放,固定的
            dataZoom: [{
              show: true,
              height: 30,
              xAxisIndex: [
                0
              ],
              bottom: 30,
              start: 10,
              end: 80,
              handleIcon: 'path://M306.1,413c0,2.2-1.8,4-4,4h-59.8c-2.2,0-4-1.8-4-4V200.8c0-2.2,1.8-4,4-4h59.8c2.2,0,4,1.8,4,4V413z',
              handleSize: '110%',
              handleStyle: {
                color: '#d3dee5'
              },
              textStyle: {
                color: '#fff'
              },
              borderColor: '#90979c'
            },
              {
                type: 'inside',
                show: true,
                height: 15,
                start: 1,
                end: 35
              }],


            // x轴是类目轴(离散数据),必须通过data设置类目数据
            xAxis: {
              type: 'category',
              data: this.xData
            },
            // y轴是数据轴(连续数据)
            yAxis: {
              type: 'value'
            },
            // 系列列表。每个系列通过 type 决定自己的图表类型
            series: [{
              // 系列中的数据内容数组
              data: this.yData,
              // 折线图
              type: 'line'
            }]
          }
          this.chart.setOption(option)
        }
      }
  }
</script>


