2019全国大学生数学建模竞赛题目 A题 高压油管的压力控制
A题 高压油管的压力控制

问题一:
稳定模型
如何设置单向阀每次开启的时长,使得高压油管内的压力尽可能稳定在 100 M P a 100MPa 100MPa左右。首先要明确高压油管的工作原理以及过程。燃油经过高压油泵从A处进入高压油管,再由喷口B喷出。燃油进入和喷出的间歇性工作过程会导致高压油管内压力的变化。
压力与密度关系
题目中给出燃油的压力变化量与密度变化量成正比,比例系数为 E ρ {\frac{E}{\rho} } ρE ,其中 ρ {\rho} ρ为为燃油的密度。
P k + 1 − P k = E ( P k ) ρ k ( ρ k + 1 − ρ k ) , k = 0 , 1 , 2 , ⋯ P_{k+1}-P_{k}=\frac{E\left(P_{k}\right)}{\rho_{k}}\left(\rho_{k+1}-\rho_{k}\right), k=0,1,2, \cdots Pk+1−Pk=ρkE(Pk)(ρk+1−ρk),k=0,1,2,⋯
首先要进行迭代计算,通过题目中所给压力与密度的出状态递推出燃油每一密度下的压力。这里实际用Excel表格就能操作:附件3-弹性模量与压力,在 C 1 C1 C1单元格填入 燃 油 密 度 ( m m 3 / m s ) 燃油密度(mm3/ms) 燃油密度(mm3/ms), C 202 C202 C202填入 0.85 0.85 0.85,对应为 100 M P a 100MPa 100MPa压力下的密度。现在将 C 201 C201 C201填入公式: = ( B 201 ∗ C 202 ) / ( B 201 − A 201 + A 202 ) =(B201*C202)/(B201-A201+A202) =(B201∗C202)/(B201−A201+A202),上拉操作;将 C 203 C203 C203填入公式: = ( B 203 ∗ C 202 ) / ( B 203 − A 203 + A 202 ) ) =(B203*C202)/(B203-A203+A202)) =(B203∗C202)/(B203−A203+A202)),下拉操作,拉满位置,此时这一列数据为对应压力下的密度。

通过 p a n d a s pandas pandas库导入文件的两列数据,用 p o l y f i t polyfit polyfit函数进行数据拟合,这里比较简便,可以选择二次项或者三次项的系数,下面完整代码有体现到这一代码的实现。这里采用了二次函数拟合,效果还算理想,也可选择其他更良好的拟合方式,不过比较麻烦,这样后续的数据会更准确。


效果还可以哈。
P ( ρ ) = 10784.65349198 ρ 2 − 15693.86029255 ρ + 5648.09019803 P(\rho)=10784.65349198\rho^{2}-15693.86029255\rho+5648.09019803 P(ρ)=10784.65349198ρ2−15693.86029255ρ+5648.09019803
ρ ( P ) = 10784.65349198 P 2 − 15693.86029255 P + 5648.09019803 \rho(P)=10784.65349198P^{2}-15693.86029255P+5648.09019803 ρ(P)=10784.65349198P2−15693.86029255P+5648.09019803
高压油管内部压力变化
进气状态
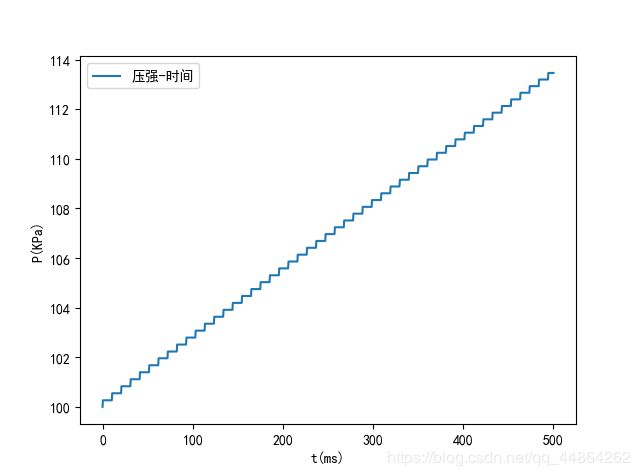
高压油管内的初始压力为 100 M P a 100MPa 100MPa,当高压油泵从A出进入高压油管时,高压油管内油气质量增大,体积不变,密度增大,此时高压油管内的压力增大。这是在起初一个较短时间内的状态。在开启了一段时长后(这段时长的参数是自己设置的,在后面要用到遍历及优化的思想,本题按 0.001 m s 0.001ms 0.001ms遍历搜索最佳时长为 0.288 m s 0.288ms 0.288ms) t1(0.288ms) 后,要关闭 10ms 。在进气阶段两个蓝色标注是非常重要的量,贯穿整个高压油管工作的始尾。下图取 500 m s 500ms 500ms为界,此时是高压油管只进行进气状态压强的变化图。
R j ( T p ) = { 0.85 × π × 0. 7 2 2 ( 160 − P j ) ρ ( 160 ) ρ ( 160 ) h 单向阀开启时 0 单向阀关闭时 R_{j}\left(T_{p}\right)=\left\{\begin{array}{ll} 0.85 \times \pi \times 0.7^{2} \sqrt{\frac{2\left(160-P_{j}\right)}{\rho(160)}} \rho(160) h& \text { 单向阀开启时 } \\ 0 & \text { 单向阀关闭时 } \end{array}\right. Rj(Tp)={0.85×π×0.72ρ(160)2(160−Pj)ρ(160)h0 单向阀开启时 单向阀关闭时
代码实现
# 进油函数 参数t为时刻,t1为进油时间段
def enter(t, t1):
    global m, P, ρ  # 全局变量,可做修改
    if 0 < t % (t1 + 10) < t1:
        Q = C * A * math.sqrt(2 * (160 - P) / ρ160)  # 单位时间进油量
        det_m = Q * ρ160 * t_  # 0.01为步长 质量改变量
        m = m + det_m  # 更新质量
        rou = m / V_primary  # 更新密度
        P = ρ_P(rou)  # 更新压强
    else:
        pass
进气过程展示
喷气状态
喷气状态题中已经给出状态图

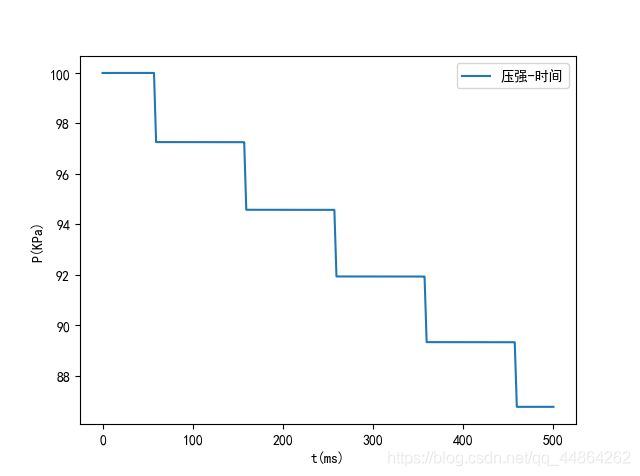
每 100 m s 100ms 100ms除了喷油嘴不工作的时间,其他时间都是在这个状态下进行的,喷油嘴喷气,高压油管内的燃油的体积不变,质量减小,密度减小,在这一时间段高压油管内的压力是减小的。这里比较重要的参数是时间段为 2.4 m s 2.4ms 2.4ms开始喷气的时间 t0(50ms) ,下图取 500 m s 500ms 500ms为界,此时是高压油管只进行喷气状态压强的变化图。
Q j ( T s ) = { 0 Mod ( t , 100 ) − T s < 0 100 ( Mod ( t , 100 ) − T s ) , 0 ≤ Mod ( t , 100 ) − T s < 0.2 ; 20 h 0.2 ≤ Mod ( t , 100 ) − T s < 2.2 ; ( 240 − 100 ( Mod ( t , 100 ) − T s ) ) h 2.2 ≤ Mod ( t , 100 ) − T s < 2.4 ; 0 2.4 ≤ Mod ( t , 100 ) − T s Q_{j}\left(T_{s}\right)=\left\{\begin{array}{ll} 0 & \operatorname{Mod}(t, 100)-T_{s}<0 \\ 100\left(\operatorname{Mod}(t, 100)-T_{s}\right) , & 0 \leq \operatorname{Mod}(t, 100)-T_{s}<0.2 ; \\ 20 h & 0.2 \leq \operatorname{Mod}(t, 100)-T_{s}<2.2 ; \\ \left(240-100\left(\operatorname{Mod}(t, 100)-T_{s}\right)\right) h & 2.2 \leq \operatorname{Mod}(t, 100)-T_{s}<2.4 ; \\ 0 & 2.4 \leq \operatorname{Mod}(t, 100)-T_{s} \end{array}\right. Qj(Ts)=⎩⎪⎪⎪⎪⎨⎪⎪⎪⎪⎧0100(Mod(t,100)−Ts),20h(240−100(Mod(t,100)−Ts))h0Mod(t,100)−Ts<00≤Mod(t,100)−Ts<0.2;0.2≤Mod(t,100)−Ts<2.2;2.2≤Mod(t,100)−Ts<2.4;2.4≤Mod(t,100)−Ts
这里使用了一个取余函数,非常精妙,确保每个周期的喷气状态与第一个喷气周期状态相等。
代码实现
# 出油函数 参数t为时刻,t0为出油时刻
def out(t, t0):
    global m, P, ρ  # 全局变量,可做修改
    if t0 < (t % 100) < t0 + 0.2:  # 第一段0~0.2ms
        Q = (t - t0) % 100 * 100  # 在不同周期内时刻的流量
        det_m = Q * ρ * t_  # 0.01为步长 质量改变量
        m = m - det_m  # 更新质量
        ρ = m / V_primary  # 更新密度
        P = ρ_P(ρ)  # 更新压强
    elif t0 + 0.2 <= (t % 100) < t0 + 2.2:  # 第二段0.2~2.2ms
        Q = 20
        det_m = Q * ρ * t_  # 0.01为步长 质量改变量
        m = m - det_m  # 更新质量
        ρ = m / V_primary  # 更新密度
        P = ρ_P(ρ)  # 更新压强
    elif t0 + 2.2 <= (t % 100) <= t0 + 2.4:  # 第三段2.2~2.4ms
        Q = ((t - t0) * (-100) + 240) % 100
        det_m = Q * ρ * t_  # 0.01为步长 质量改变量
        m = m - det_m  # 更新质量
        ρ = m / V_primary  # 更新密度
        P = ρ_P(ρ)  # 更新压强
    else:
        pass
进喷气状态结合
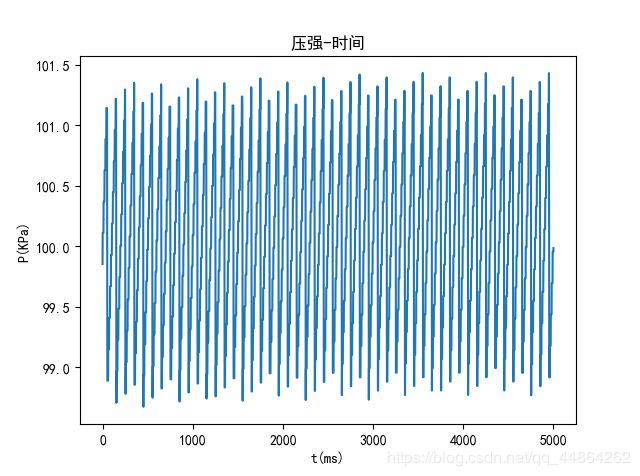
进气状态和喷气状态是一个相互的过程,在高压油管工作时,进喷气会存在同时进行的状态。这时只需更改喷气开始的时间 t0 与进气时长 t1 ,便可得到想要的结果,这里取 5000 m s 5000ms 5000ms的时长。
m i n ∑ k = 1 n ∣ P k − 100 ∣ = m i n ∑ k = 1 n ∣ ∑ j = 0 k − 1 E ( P j ) V ρ j ( R j ( T p ) − Q j ( T s ) ) min\sum_{k=1}^{n}|P_{k}-100|=min\sum_{k=1}^{n}|\sum_{j=0}^{k-1}\frac{E(P_{j})}{V\rho _{j}}(R_{j}(T_{p})-Q_{j}(T_{s})) min∑k=1n∣Pk−100∣=min∑k=1n∣∑j=0k−1VρjE(Pj)(Rj(Tp)−Qj(Ts))
关于进喷气函数的编程实现
整个过程是在 t = 0.01 m s t=0.01ms t=0.01ms的逐步递推进行的,首先要想到 t = 0 t=0 t=0的出状态,自己可以在纸上写一下,经过 t = 0.01 m s t=0.01ms t=0.01ms高压油管的状态是什么,经过 t = 0.01 m s + 0.01 m s = 0.02 m s t=0.01ms+0.01ms=0.02ms t=0.01ms+0.01ms=0.02ms高压油管的状态是什么,首先计算单位时间进油量,乘 160 M P a 160MPa 160MPa密度即为进入的质量,质量变化、体积不变、密度变化、压强变化,每走 0.01 m s 0.01ms 0.01ms更新一下高压油管内压强的状态,即可完成整个过程.
关于遍历及优化的编程实现
这个考虑到高压油管内部压强比较稳定,所以进喷气的质量大致相同,取质量相同求得 t 0 = 0.28 m s t0=0.28ms t0=0.28ms,在附近进行遍历即可。
优化这个可以自己设计,本题要求在 100 M P a 100MPa 100MPa较稳定的工作状态,我们可以计算整个函数与 P = 100 M P a P=100MPa P=100MPa的面积,面积越小时优化结果越好。但是在实际代码设计优化状态下可能会出现问题,这个我们还要自己把握。我的想法每遍历一次输出一张图片到文件夹里,然后打开文件夹翻阅查看,再通过那段区间设置优化的限制。
稳定模型完整代码
代码比较灵活,里面参数可以自行修改,在使用时要导入 p y t h o n python python第三方库。
import numpy as np
import pandas as pd
import matplotlib.pyplot as plt
import math

data = '附件3-弹性模量与压力.xlsx'
data = pd.read_excel('附件3-弹性模量与压力.xlsx')  # 导入附件3数据
plt.rcParams['font.sans-serif'] = ['SimHei']  # 用来正常显示中文标签
plt.rcParams['axes.unicode_minus'] = False  # 用来正常显示负号

x_pandas_list = data[u'燃油密度(mm3/ms)']  # 附件3 燃油密度列数据
y_pandas_list = data[u'压力(MPa)']  # 附件3 压力列数据

coefficient1_numpy_list = np.polyfit(x_pandas_list, y_pandas_list,
                                     2)  # [ 10784.65349198 -15693.86029255   5648.09019803]y=压强 x=密度拟合系数


def ρ_P(x):  # 密度转压力函数
    return coefficient1_numpy_list[0] * x ** 2 + coefficient1_numpy_list[1] * x + coefficient1_numpy_list[2]


plt.scatter(x_pandas_list, y_pandas_list, s=1, label='真实数据', color='#FFA500')  # 绘制压强密度散点图(真实数据)调了橙色
plt.plot(x_pandas_list, ρ_P(x_pandas_list), label='拟合数据', color='#1E90FF')  # 绘制压强密度图像(拟合数据)调了蓝色
plt.title('燃油密度(mm3/ms)-压力(MPa)')
plt.xlabel('燃油密度(mm3/ms)')
plt.ylabel('压力(MPa)')
plt.legend()  # 显示标注label
plt.show()  # 画图显示

coefficient2_numpy_list = np.polyfit(y_pandas_list, x_pandas_list,
                                     2)  # [-6.59843062e-07  5.23409641e-04  8.04251284e-01]y=密度 x=压强拟合系数


def P_ρ(x):  # 压力转密度函数
    return coefficient2_numpy_list[0] * x ** 2 + coefficient2_numpy_list[1] * x + coefficient2_numpy_list[2]


plt.scatter(y_pandas_list, x_pandas_list, s=1, label='真实数据', color='#FFA500')  # 绘制压强密度散点图(真实数据)调了橙色
plt.plot(ρ_P(x_pandas_list), x_pandas_list, label='拟合数据', color='#1E90FF')  # 绘制压强密度图像(拟合数据)调了蓝色
plt.title('压力(MPa)-燃油密度(mm3/ms)')
plt.xlabel('压力(MPa)')
plt.ylabel('燃油密度(mm3/ms)')
plt.legend()  # 显示标注label
plt.show()  # 画图显示

C = 0.85  # 流量系数

d_a = 1.4  # 小孔处的直径1.4mm
r_a = d_a / 2  # 小孔处的半径1.4mm
A = S_a = math.pi * r_a ** 2  # 小孔处的面积1.5393804002589984mm2

l_primary = 500  # 内腔长度500mm
d_primary = 10  # 内腔直径10mm
r_primary = d_primary / 2  # 内腔半径5mm
S_primary = math.pi * r_primary ** 2  # 内腔横截面积78.53981633974483mm2
V_primary = S_primary * l_primary  # 内腔体积39269.90816987242mm3

ρ0 = 0.85  # 初始100MPa压力下的密度
ρ160 = P_ρ(160)  # 160MPa压力下的密度 0.8711048440368855mg/mm3
m0 = ρ0 * V_primary  # 初始高压油管油气33379.42194439156mg

t = 0  # 记录时刻
t_ = 0.01  # 每隔0.01ms时间段刷新一次状态
m = m0  # 记录每一时刻高压油管内的质量 初始为m0
P = 100  # 记录每一时刻高压油管内的压强
ρ = 0.85  # 录每一时刻高压油管内的密度
P_list = []  # 压强时刻表


# 进油函数 参数t为时刻,t1为进油时间段
def enter(t, t1):
    global m, P, ρ  # 全局变量,可做修改
    if 0 < t % (t1 + 10) < t1:
        Q = C * A * math.sqrt(2 * (160 - P) / ρ160)  # 单位时间进油量
        det_m = Q * ρ160 * t_  # 0.01为步长 质量改变量
        m = m + det_m  # 更新质量
        rou = m / V_primary  # 更新密度
        P = ρ_P(rou)  # 更新压强
    else:
        pass


# 出油函数 参数t为时刻,t0为出油时刻
def out(t, t0):
    global m, P, ρ  # 全局变量,可做修改
    if t0 < (t % 100) < t0 + 0.2:  # 第一段0~0.2ms
        Q = (t - t0) % 100 * 100  # 在不同周期内时刻的流量
        det_m = Q * ρ * t_  # 0.01为步长 质量改变量
        m = m - det_m  # 更新质量
        ρ = m / V_primary  # 更新密度
        P = ρ_P(ρ)  # 更新压强
    elif t0 + 0.2 <= (t % 100) < t0 + 2.2:  # 第二段0.2~2.2ms
        Q = 20
        det_m = Q * ρ * t_  # 0.01为步长 质量改变量
        m = m - det_m  # 更新质量
        ρ = m / V_primary  # 更新密度
        P = ρ_P(ρ)  # 更新压强
    elif t0 + 2.2 <= (t % 100) <= t0 + 2.4:  # 第三段2.2~2.4ms
        Q = ((t - t0) * (-100) + 240) % 100
        det_m = Q * ρ * t_  # 0.01为步长 质量改变量
        m = m - det_m  # 更新质量
        ρ = m / V_primary  # 更新密度
        P = ρ_P(ρ)  # 更新压强
    else:
        pass


sum_min = 10000000000000  # 刷新压力波动最小值
P_list_min = []  # 波动最小的压力差表
i_best = 0  # 最优开阀门时长
j_best = 0  # 最优出气时刻

for i in np.arange(0.287, 0.29, 0.001):  # 遍历开阀门时长 start->end
    for j in np.arange(50, 56.5, 1):  # 遍历出气时刻 start->end
        sum = 0  # 记录压力波动偏差
        t = 0  # 每次循环刷新时刻从0开始
        P_list = []  # 每次循环刷新压力时刻表 为空表
        while t <= 5000:  # 时间可修改,单位为ms 循环2000/t_次
            t = t + t_
            enter(t, i)
            out(t, j)
            P_list.append(P)
            sum = sum + abs(P - 100)  # 每隔t_=0.01ms时刻记录一下总波动 best=sum|P-100|
        print('开始遍历:', 'i =', i, 'j =', j)
        print('压差距离最优质值和(越小越好):', sum)
        if sum_min > sum:
            sum_min = sum
            i_best = i
            j_best = j
            P_list_min = P_list

print('最优开阀门时长为:', i_best, '最优出气时刻为:', j_best)

len_P_list = len(P_list)  # 长度为设值遍历长度个
x_numpy_list = np.arange(0, len_P_list * t_, t_)  # 每隔0.01ms列一个x坐标与P_list对应

plt.plot(x_numpy_list, P_list_min)
plt.title('压强-时间')
plt.xlabel('t(ms)')
plt.ylabel('P(KPa)')
plt.show()
增压模型
想要压力维持在 150 M P a 150MPa 150MPa上下,开启进气阀的时长需要设置在 0.75 m s 0.75ms 0.75ms,这里 0.75 m s 0.75ms 0.75ms是进气阀的时长遍历的结果。稍微修改一下上述代码的压强与密度初始值。
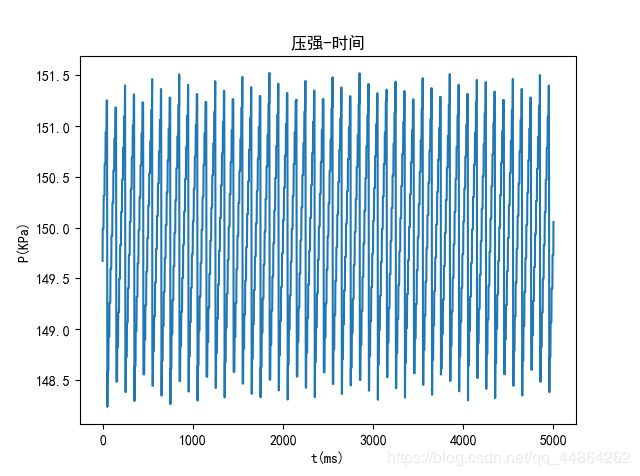
已知 0.75 m s 0.75ms 0.75ms作为 150 M P a 150MPa 150MPa下的开阀时长,现在要求的是,单向阀每次开启的时长多少时,经过 2 s , 5 s , 10 s 2s,5s,10s 2s,5s,10s分别到达150Mpa。
①2s(100MPa->150Mpa)
在 2 s 2s 2s前单向阀每次开启的时长 0.89 m s 0.89ms 0.89ms,达到稳定后单向阀每次开启的时长 0.75 m s 0.75ms 0.75ms。

②5s(100MPa->150Mpa)
在 5 s 5s 5s前单向阀每次开启的时长 0.75 m s 0.75ms 0.75ms,达到稳定后单向阀每次开启的时长 0.75 m s 0.75ms 0.75ms。
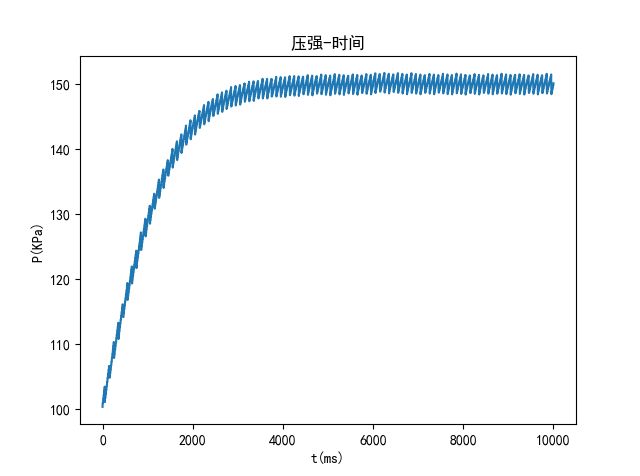
③10s(100MPa->150Mpa)
在 8 s 8s 8s前单向阀每次开启的时长 0.50 m s 0.50ms 0.50ms,在 8 s − 10 s 8s-10s 8s−10s单向阀每次开启的时长 0.75 m s 0.75ms 0.75ms,达到稳定后单向阀每次开启的时长 0.75 m s 0.75ms 0.75ms。

关于这个每次开启的时长 0.50 m s 0.50ms 0.50ms这个参数,可以修改,合理即可,没有唯一答案。
问题二
凸轮
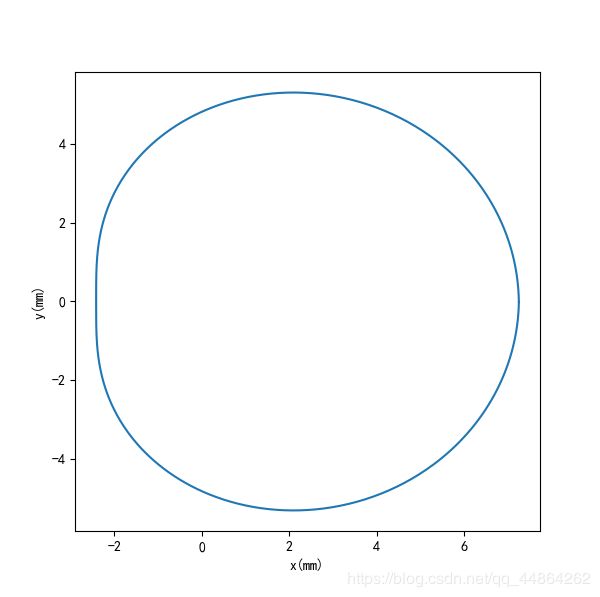
在上一问题中,进气状态所给压力恒定为 160 M P a 160MPa 160MPa。但在这里,高压油管的进气由凸轮转动提供,首先要明白凸轮是如何转动的,这是关键的一步。
凸轮工作原理
由这张图我们可以看出,凸轮的旋转是在二维平面中进行的。凸轮起始的位置为极径最大的位置,此时活塞位于柱塞腔的顶部,凸轮每转一周,向高压活塞压入一次气体,使高压油管的压力增大。这一过程的描述为:活塞由顶部运动到底部,此时不向高压油管内注入气体;当活塞由底部向顶部运动时,压力由 0.5 M P a 0.5MPa 0.5MPa增大,当压力增大到 100 M P a 100MPa 100MPa时,会向高压油管压入气体,此时柱塞腔燃气的质量减小,判断柱塞腔此时压力的变化。
关于凸轮形状
凸轮形状在附件1-凸轮边缘曲线已经给出
极角(弧度制)与极径的关系是
R ( θ ) = 2.39658307 × 1 0 − 3 θ 6 − 4.51694471 × 1 0 − 2 θ 5 + 2.59343668 × 1 0 − 1 θ 4 − 2.87191168 × 1 0 − 3 θ 3 − 9.49901781 × 1 0 − 1 θ 2 − 9.45855190 × 1 0 − 2 θ + 7.24715714 R(\theta)=2.39658307 \times10^{-3}\theta^{6}-4.51694471 \times10^{-2}\theta^{5}+ 2.59343668 \times10^{-1}\theta^{4}-2.87191168 \times10^{-3}\theta^{3}-9.49901781 \times10^{-1}\theta^{2}-9.45855190\times10^{-2}\theta+7.24715714 R(θ)=2.39658307×10⁻³θ6−4.51694471×10⁻²θ5+2.59343668×10⁻¹θ4−2.87191168×10⁻³θ3−9.49901781×10⁻¹θ2−9.45855190×10⁻²θ+7.24715714
凸轮形状拟合代码
import numpy as np
import pandas as pd
import matplotlib.pyplot as plt
import math

data = '附件3-弹性模量与压力.xlsx'
data = pd.read_excel('附件3-弹性模量与压力.xlsx')  # 导入附件3数据
plt.rcParams['font.sans-serif'] = ['SimHei']  # 用来正常显示中文标签
plt.rcParams['axes.unicode_minus'] = False  # 用来正常显示负号
x_pandas_list = data[u'燃油密度(mm3/ms)']  # 附件3 燃油密度列数据
y_pandas_list = data[u'压力(MPa)']  # 附件3 压力列数据
coefficient1_numpy_list = np.polyfit(x_pandas_list, y_pandas_list,
                                     2)  # [ 10784.65349198 -15693.86029255   5648.09019803]y=压强 x=密度拟合系数


def ρ_P(x):  # 密度转压力函数
    return coefficient1_numpy_list[0] * x ** 2 + coefficient1_numpy_list[1] * x + coefficient1_numpy_list[2]


coefficient2_numpy_list = np.polyfit(y_pandas_list, x_pandas_list,
                                     2)  # [-6.59843062e-07  5.23409641e-04  8.04251284e-01]y=密度 x=压强拟合系数


def P_ρ(x):  # 压力转密度函数
    return coefficient2_numpy_list[0] * x ** 2 + coefficient2_numpy_list[1] * x + coefficient2_numpy_list[2]


plt.rcParams['font.sans-serif'] = ['SimHei']  # 用来正常显示中文标签
plt.rcParams['axes.unicode_minus'] = False  # 用来正常显示负号
data = '附件1-凸轮边缘曲线.xlsx'
data = pd.read_excel(data)

x_pandas_list1 = data[u'极角(rad)']
y_pandas_list1 = data[u'极径(mm)']

cof = np.polyfit(x_pandas_list1, y_pandas_list1, 6)  # 凸轮 x-极角 y-极径拟合系数


def y_(x):
    return cof[0] * x ** 6 + cof[1] * x ** 5 + cof[2] * x ** 4 + cof[3] * x ** 3 + cof[4] * x ** 2 + cof[5] * x + cof[6]


plt.scatter(x_pandas_list1, y_pandas_list1, s=0.1, label='真实数据', color='#FFA500')  # 绘制压强密度散点图(真实数据)调了橙色
plt.plot(x_pandas_list1, y_(x_pandas_list1), label='拟合数据', color='#1E90FF')  # 绘制压强密度图像(拟合数据)调了蓝色
plt.xlabel('x(mm)')
plt.ylabel('y(mm)')
plt.legend()
plt.show()

theta = np.arange(0, 2 * np.pi, 0.01)
x = y_(theta) * np.cos(theta)
y = y_(theta) * np.sin(theta)
# 绘图
plt.figure(figsize=(6, 6))
plt.xlabel('x(mm)')
plt.ylabel('y(mm)')
plt.plot(x, y)
plt.show()  # 显示凸轮形状
柱塞腔活塞位置
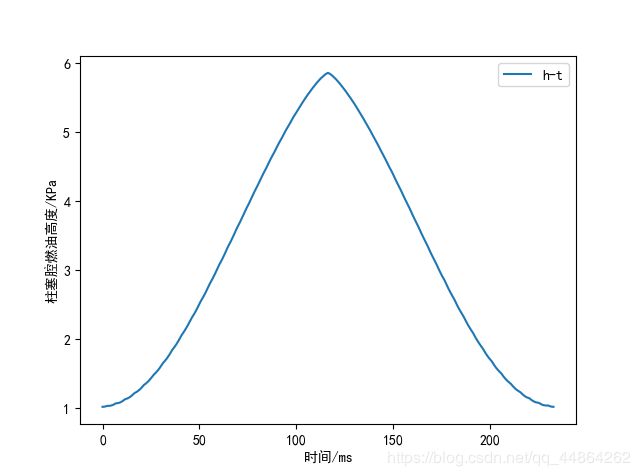
凸轮的顶部(每一极角下纵坐标的最大值)带动活塞的上升与下降,由此导致了柱塞腔燃气的密度、质量、压力变化。
这个柱塞腔活塞位置其实是涉及到凸轮的角速度的,这个可以先估算一个大致区间然后带入一个数画图看效果。这个区间估算方法是 每个周期进气量大致等于喷气量,通过搜索算法确定步长,当压力差之和最小时就可以确定凸轮角速度。
代码实现
import numpy as np
import pandas as pd
import matplotlib.pyplot as plt
import math

data = '附件3-弹性模量与压力.xlsx'
data = pd.read_excel('附件3-弹性模量与压力.xlsx')  # 导入附件3数据
plt.rcParams['font.sans-serif'] = ['SimHei']  # 用来正常显示中文标签
plt.rcParams['axes.unicode_minus'] = False  # 用来正常显示负号
x_pandas_list = data[u'燃油密度(mm3/ms)']  # 附件3 燃油密度列数据
y_pandas_list = data[u'压力(MPa)']  # 附件3 压力列数据
coefficient1_numpy_list = np.polyfit(x_pandas_list, y_pandas_list,
                                     2)  # [ 10784.65349198 -15693.86029255   5648.09019803]y=压强 x=密度拟合系数


def ρ_P(x):  # 密度转压力函数
    return coefficient1_numpy_list[0] * x ** 2 + coefficient1_numpy_list[1] * x + coefficient1_numpy_list[2]


coefficient2_numpy_list = np.polyfit(y_pandas_list, x_pandas_list,
                                     2)  # [-6.59843062e-07  5.23409641e-04  8.04251284e-01]y=密度 x=压强拟合系数


def P_ρ(x):  # 压力转密度函数
    return coefficient2_numpy_list[0] * x ** 2 + coefficient2_numpy_list[1] * x + coefficient2_numpy_list[2]


plt.rcParams['font.sans-serif'] = ['SimHei']  # 用来正常显示中文标签
plt.rcParams['axes.unicode_minus'] = False  # 用来正常显示负号
data = '附件1-凸轮边缘曲线.xlsx'
data = pd.read_excel(data)

x_pandas_list1 = data[u'极角(rad)']
y_pandas_list1 = data[u'极径(mm)']

cof = np.polyfit(x_pandas_list1, y_pandas_list1, 6)  # 凸轮 x-极角 y-极径拟合系数


def y_(x):
    return cof[0] * x ** 6 + cof[1] * x ** 5 + cof[2] * x ** 4 + cof[3] * x ** 3 + cof[4] * x ** 2 + cof[5] * x + cof[6]


ω = 0.027  # 弧度制下的角速度rad/ms
T = 2 * math.pi / ω  # 凸轮运动周期时间 单位ms
t_ = 0.1  # 每隔0.01ms时间段刷新一次状态
α0 = 0  # 初始时刻凸轮旋转角度0
α = α0  # 记录凸轮旋转角度时刻
t = 0  # 记录时刻
H_list = []  # 记录每一时刻活塞距离腔底部的位置
ρ_list = []  # 记录每一时刻活塞距离腔底部的密度
P_list = []  # 记录每一时刻活塞距离腔底部的压力

hMax = 0  # 记录每一时刻高度的最大值
ρ_camj = P_ρ(0.5)  # 初始时刻压强
d_camj = 5  # 柱塞腔直径5mm
r_camj = d_camj / 2  # 柱塞腔半径2.5mm
s_camj = math.pi * r_camj ** 2
v_part = 20  # 向上残余容积为20mm3
h_part = v_part / s_camj  # 向上残余高度
m0_camj = 92.4217168684373  # 初始时刻柱塞腔油气质量
m_camj = m0_camj  # 每一时刻柱塞腔油气质量

C = 0.85  # 流量系数

d_a = 1.4  # 小孔处的直径1.4mm
r_a = d_a / 2  # 小孔处的半径1.4mm
A = S_a = math.pi * r_a ** 2  # 小孔处的面积1.5393804002589984mm2

l_primary = 500  # 内腔长度500mm
d_primary = 10  # 内腔直径10mm
r_primary = d_primary / 2  # 内腔半径5mm
S_primary = math.pi * r_primary ** 2  # 内腔横截面积78.53981633974483mm2
V_primary = S_primary * l_primary  # 内腔体积39269.90816987242mm3


def cam_h(t):  # x为时刻 返回值为活塞距离柱塞腔底部的高度
    global α, hMax  # 全局变量可做修改
    hmax = 0  # 记录这一时刻下活塞向上运动的最大值
    for i in np.arange(0, 2 * math.pi, 0.1):  # 弧度制遍历
        h_point = y_(i) * math.cos(ω * t + i)  # 每一时间点下不同弧度坐标位置 h_point y坐标
        if h_point > hmax:  # 把每一个极角遍历出的最大值传递给hmax
            hmax = h_point
            hMax = 7.247588972988529 - hmax + h_part
    return hMax


while t < T:  # 遍历凸轮旋转一个周期 遍历单位为t_可以自行设计
    ρ_list.append(cam_h(t))
    t = t + t_

x_numpy_list = np.arange(0, len(ρ_list) * t_, t_)  # 选择
plt.plot(x_numpy_list, ρ_list, label='h-t')
plt.xlabel('时间/ms')
plt.ylabel('柱塞腔燃油高度/KPa')
plt.legend()
plt.show()
柱塞腔内燃气压力
柱塞腔内压力随着活塞的上升而增大,在后半个周期内,压强首先增大到 100 M P a 100MPa 100MPa,然后在 100 M P a 100MPa 100MPa来回波动,大于 100 M P a 100MPa 100MPa的部分会在下一次迭代过程中将燃气压入高压油管,致使柱塞腔内的体积减小。
ρ cam j = m camj 2. 5 2 π u ( ω t j ) \rho_{\text {cam } j}=\frac{m_{\text {camj }}}{2.5^{2} \pi u\left(\omega t_{j}\right)} ρcam j=2.52πu(ωtj)mcamj
m c a m j m_{camj} mcamj为柱塞腔内燃气的质量, u ( ω t j ) u(\omega t_{j}) u(ωtj)为活塞的上升高度,参数为 ω \omega ω。
P ( ρ ) = 10784.65349198 ρ 2 − 15693.86029255 ρ + 5648.09019803 P(\rho)=10784.65349198\rho^{2}-15693.86029255\rho+5648.09019803 P(ρ)=10784.65349198ρ2−15693.86029255ρ+5648.09019803
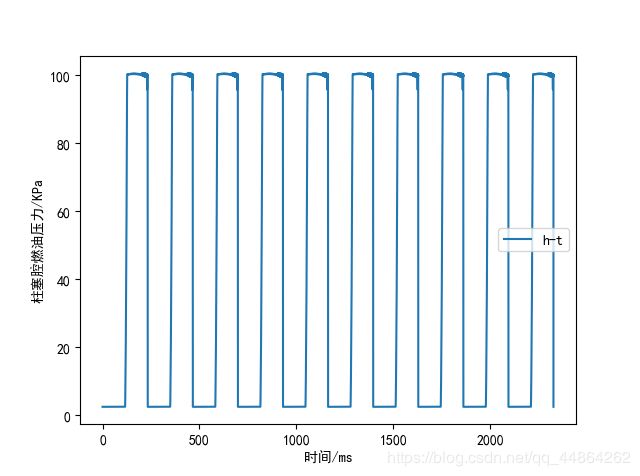
代码实现
import numpy as np
import pandas as pd
import matplotlib.pyplot as plt
import math

data = '附件3-弹性模量与压力.xlsx'
data = pd.read_excel('附件3-弹性模量与压力.xlsx')  # 导入附件3数据
plt.rcParams['font.sans-serif'] = ['SimHei']  # 用来正常显示中文标签
plt.rcParams['axes.unicode_minus'] = False  # 用来正常显示负号
x_pandas_list = data[u'燃油密度(mm3/ms)']  # 附件3 燃油密度列数据
y_pandas_list = data[u'压力(MPa)']  # 附件3 压力列数据
coefficient1_numpy_list = np.polyfit(x_pandas_list, y_pandas_list,
                                     2)  # [ 10784.65349198 -15693.86029255   5648.09019803]y=压强 x=密度拟合系数


def ρ_P(x):  # 密度转压力函数
    return coefficient1_numpy_list[0] * x ** 2 + coefficient1_numpy_list[1] * x + coefficient1_numpy_list[2]


coefficient2_numpy_list = np.polyfit(y_pandas_list, x_pandas_list,
                                     2)  # [-6.59843062e-07  5.23409641e-04  8.04251284e-01]y=密度 x=压强拟合系数


def P_ρ(x):  # 压力转密度函数
    return coefficient2_numpy_list[0] * x ** 2 + coefficient2_numpy_list[1] * x + coefficient2_numpy_list[2]


plt.rcParams['font.sans-serif'] = ['SimHei']  # 用来正常显示中文标签
plt.rcParams['axes.unicode_minus'] = False  # 用来正常显示负号
data = '附件1-凸轮边缘曲线.xlsx'
data = pd.read_excel(data)

x_pandas_list1 = data[u'极角(rad)']
y_pandas_list1 = data[u'极径(mm)']

cof = np.polyfit(x_pandas_list1, y_pandas_list1, 6)  # 凸轮 x-极角 y-极径拟合系数


def y_(x):
    return cof[0] * x ** 6 + cof[1] * x ** 5 + cof[2] * x ** 4 + cof[3] * x ** 3 + cof[4] * x ** 2 + cof[5] * x + cof[6]


ω = 0.027  # 弧度制下的角速度rad/ms
T = 2 * math.pi / ω  # 凸轮运动周期时间 单位ms
t_ = 0.01  # 每隔0.01ms时间段刷新一次状态
α0 = 0  # 初始时刻凸轮旋转角度0
α = α0  # 记录凸轮旋转角度时刻
t = 0  # 记录时刻
H_list = []  # 记录每一时刻活塞距离腔底部的位置
ρ_list = []  # 记录每一时刻活塞距离腔底部的密度
P_list = []  # 记录每一时刻活塞距离腔底部的压力

hMax = 0  # 记录每一时刻高度的最大值
P_camj = 0.5  # 初始时刻压力
ρ_camj = P_ρ(0.5)  # 初始时刻密度
d_camj = 5  # 柱塞腔直径5mm
r_camj = d_camj / 2  # 柱塞腔半径2.5mm
s_camj = math.pi * r_camj ** 2
v_part = 20  # 向上残余容积为20mm3
h_part = v_part / s_camj  # 向上残余高度
m0_camj = 92.4217168684373  # 初始时刻柱塞腔油气质量
m_camj = m0_camj  # 每一时刻柱塞腔油气质量

C = 0.85  # 流量系数

d_a = 1.4  # 小孔处的直径1.4mm
r_a = d_a / 2  # 小孔处的半径1.4mm
A = S_a = math.pi * r_a ** 2  # 小孔处的面积1.5393804002589984mm2

l_primary = 500  # 内腔长度500mm
d_primary = 10  # 内腔直径10mm
r_primary = d_primary / 2  # 内腔半径5mm
S_primary = math.pi * r_primary ** 2  # 内腔横截面积78.53981633974483mm2
V_primary = S_primary * l_primary  # 内腔体积39269.90816987242mm3


def cam_h(t):  # x为时刻 返回值为活塞距离柱塞腔底部的高度
    global α, hMax  # 全局变量可做修改
    hmax = 0  # 记录这一时刻下活塞向上运动的最大值
    for i in np.arange(0, 2 * math.pi, 0.1):  # 弧度制遍历
        h_point = y_(i) * math.cos(ω * t + i)  # 每一时间点下不同弧度坐标位置 h_point y坐标
        if h_point > hmax:  # 把每一个极角遍历出的最大值传递给hmax
            hmax = h_point
            hMax = 7.247588972988529 - hmax + h_part
    return hMax


def P_cam(t):  # 柱塞腔返回t时刻下的压力
    return ρ_P(ρ_cam(t))


def ρ_cam(t):  # 柱塞腔返回t时刻下燃油的密度
    global m_camj, ρ_camj, P_camj
    if t % T <= T / 2:
        m_camj = m0_camj
        P_camj = 0.5
    else:
        if P_camj <= 100:
            ρ_camj = m_camj / (s_camj * cam_h(t))  # 更新密度
            P_camj = ρ_P(ρ_camj)  # 更新压强
        else:
            det_m = C * A * math.sqrt(2 * (P_camj - 100) / ρ_camj) * ρ_camj * t_
            m_camj = m_camj - det_m
            ρ_camj = m_camj / (s_camj * cam_h(t))  # 更新密度
            P_camj = ρ_P(ρ_camj)  # 更新压强


while t <= 10 * T:  # 遍历凸轮旋转一个周期 遍历单位为t_可以自行设计
    t = t + t_
    ρ_cam(t)
    ρ_list.append(P_camj)

x_numpy_list = np.arange(0, len(ρ_list) * t_, t_)  # 选择
plt.plot(x_numpy_list, ρ_list, label='h-t')
plt.xlabel('时间/ms')
plt.ylabel('柱塞腔燃油压力/KPa')
plt.legend()
plt.show()
流入气体质量
ρ cam j = m camj 2. 5 2 π u ( ω t j ) \rho_{\text {cam } j}=\frac{m_{\text {camj }}}{2.5^{2} \pi u\left(\omega t_{j}\right)} ρcam j=2.52πu(ωtj)mcamj
R j ( ω ) = { 0.85 × π × 0. 7 2 2 ( P camj − P tubj ) × ρ canj h , P camj > P tubj 0 , P canj ⩽ P tubj , R_{j}(\omega)=\left\{\begin{array}{ll} 0.85 \times \pi \times 0.7^{2} \sqrt{2\left(P_{\text {camj }}-P_{\text {tubj }}\right) \times \rho_{\text {canj }}} h, & P_{\text {camj }}>P_{\text {tubj }} \\ 0, & P_{\text {canj }} \leqslant P_{\text {tubj }}, \end{array}\right. Rj(ω)={0.85×π×0.722(Pcamj −Ptubj )×ρcanj h,0,Pcamj >Ptubj Pcanj ⩽Ptubj ,
针阀运动
针阀运动拟合曲线
这两组参数是用 p o l y f i t polyfit polyfit拟合出来的六次项系数,分别为分段函数的第一段与第三段系数,在实际程序设计中还要考虑到取余函数,周期为 200 m s 200ms 200ms。
[ 1.59403345e+02 -9.87538422e+02 6.79811142e+02 -1.22515750e+02 1.16775838e+01 -4.11282406e-01 2.67578428e-03]
[ 136.60587618 -1049.78616172 1227.80919016 10922.44930413-43933.87168977 63132.03256009 -32700.74327951]
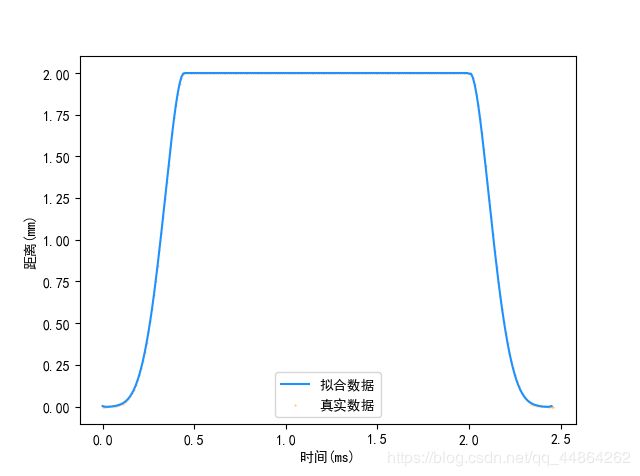
分段函数拟合代码实现
import numpy as np
import pandas as pd
import matplotlib.pyplot as plt
import math

data = '附件2-针阀运动曲线.xlsx'
data = pd.read_excel('附件2-针阀运动曲线.xlsx')  # 导入附件3数据
plt.rcParams['font.sans-serif'] = ['SimHei']  # 用来正常显示中文标签
plt.rcParams['axes.unicode_minus'] = False  # 用来正常显示负号
x_pandas_list = data[u'时间(ms)']  # 附件2 时间数据
y_pandas_list = data[u'距离(mm)']  # 附件2 距离数据

print(y_pandas_list)
plt.xlabel('时间(ms)')
plt.ylabel('距离(mm)')
plt.scatter(x_pandas_list, y_pandas_list, s=0.1, label='真实数据', color='#FFA500')

y1_pandas_list = y_pandas_list[0:46]
x1_pandas_list = x_pandas_list[0:46]
cof1 = np.polyfit(x1_pandas_list, y1_pandas_list, 6)  # 第一段分段函数系数[15.39735971 -1.93086567  0.026043  ]

y2_pandas_list = y_pandas_list[200:246]
x2_pandas_list = x_pandas_list[200:246]
cof2 = np.polyfit(x2_pandas_list, y2_pandas_list, 6)  # 第三段分段函数系数[ 15.44372154 -73.71211028  87.92142494]
h_s = 0
Aj = 0


def H(t):
    global h_s
    if 0 < t % 200 <= 0.45:
        h_s = cof1[0] * (t % 200) ** 6 + cof1[1] * (t % 200) ** 5 + cof1[2] * (t % 200) ** 4 + cof1[3] \
              * (t % 200) ** 3 + cof1[4] * (t % 200) ** 2 + cof1[5] * (t % 200) + cof1[6]
    elif 0.45 < t % 200 < 2:
        h_s = 2
    elif 2 <= t % 200 < 2.45:
        h_s = cof2[0] * (t % 200) ** 6 + cof2[1] * (t % 200) ** 5 + cof2[2] * (t % 200) ** 4 + cof2[3] \
              * (t % 200) ** 3 + cof2[4] * (t % 200) ** 2 + cof2[5] * (t % 200) + cof2[6]
    else:
        h_s = 0


h_s_list = []  # 记录针阀高度列表
t = 0
t_ = 0.01
while t <= 2.45:
    H(t)
    h_s_list.append(h_s)
    t = t + t_

x_np_list = np.arange(0, len(h_s_list) * 0.01, 0.01)  # 时间轴表示
plt.plot(x_np_list, h_s_list, label='拟合数据', color='#1E90FF')
plt.legend()
plt.show()
流出气体质量
起初针阀向上运动时,针阀与底部开口面积较小,燃气可以全部流出。当针阀与底部开口面积小于底部孔面积时,这时燃气的流出面积为底部孔面积。
A j = { π ( 1.25 + H ( t j ) tan ( π / 20 ) ) 2 − 1.2 5 2 π , t j < 0.33 0. 7 2 π , 0.33 ⩽ t j < 6 − 0.33 π ( 1.25 + H ( 6 − t j ) tan ( π / 20 ) ) 2 − 1.2 5 2 π , 6 − 0.33 ⩽ t j < 6 0 , 6 ⩽ t j < 100 A_{j}=\left\{\begin{array}{ll} \pi\left(1.25+H\left(t_{j}\right) \tan (\pi / 20)\right)^{2}-1.25^{2} \pi, & t_{j}<0.33 \\ 0.7^{2} \pi, & 0.33 \leqslant t_{j}<\sqrt{6}-0.33 \\ \pi\left(1.25+H\left(\sqrt{6}-t_{j}\right) \tan (\pi / 20)\right)^{2}-1.25^{2} \pi, & \sqrt{6}-0.33 \leqslant t_{j}<\sqrt{6} \\ 0, & \sqrt{6} \leqslant t_{j}<100 \end{array}\right. Aj=⎩⎪⎪⎪⎨⎪⎪⎪⎧π(1.25+H(tj)tan(π/20))2−1.252π,0.72π,π(1.25+H(6−tj)tan(π/20))2−1.252π,0,tj<0.330.33⩽tj<6−0.336−0.33⩽tj<66⩽tj<100
A j A_{j} Aj为流出的气体面积
Q j ( ω ) = 0.85 × A j 2 P tubj × ρ tubj h Q_{j}(\omega)=0.85 \times A_{j} \sqrt{2 P_{\text {tubj }} \times \rho_{\text {tubj }}} h Qj(ω)=0.85×Aj2Ptubj ×ρtubj h
Q j ( ω ) Q_{j}(\omega) Qj(ω)为单位时间内刘出气体质量

代码实现
import numpy as np
import pandas as pd
import matplotlib.pyplot as plt
import math

data = '附件2-针阀运动曲线.xlsx'
data = pd.read_excel('附件2-针阀运动曲线.xlsx')  # 导入附件3数据
plt.rcParams['font.sans-serif'] = ['SimHei']  # 用来正常显示中文标签
plt.rcParams['axes.unicode_minus'] = False  # 用来正常显示负号
x_pandas_list = data[u'时间(ms)']  # 附件2 时间数据
y_pandas_list = data[u'距离(mm)']  # 附件2 距离数据

print(y_pandas_list)


y1_pandas_list = y_pandas_list[0:46]
x1_pandas_list = x_pandas_list[0:46]
cof1 = np.polyfit(x1_pandas_list, y1_pandas_list, 6)  # 第一段分段函数系数[15.39735971 -1.93086567  0.026043  ]

y2_pandas_list = y_pandas_list[200:246]
x2_pandas_list = x_pandas_list[200:246]
cof2 = np.polyfit(x2_pandas_list, y2_pandas_list, 6)  # 第三段分段函数系数[ 15.44372154 -73.71211028  87.92142494]
A_s = 0


def H(t):
    if 0 < t % 200 <= 0.45:
        return cof1[0] * (t % 200) ** 6 + cof1[1] * (t % 200) ** 5 + cof1[2] * (t % 200) ** 4 + cof1[3] \
              * (t % 200) ** 3 + cof1[4] * (t % 200) ** 2 + cof1[5] * (t % 200) + cof1[6]
    elif 0.45 < t % 200 < 2:
        return 2
    elif 2 <= t % 200 < 2.45:
        return cof2[0] * (t % 200) ** 6 + cof2[1] * (t % 200) ** 5 + cof2[2] * (t % 200) ** 4 + cof2[3] \
              * (t % 200) ** 3 + cof2[4] * (t % 200) ** 2 + cof2[5] * (t % 200) + cof2[6]
    else:
        return 0


A_list = []  # 记录针阀高度列表
t = 0
t_ = 0.01


def Aj(t): #阻塞模型下的流出面积
    global A_s
    if t % 200 < 0.33:
        A_s = math.pi * (1.25 + H(t) * math.tan(math.pi / 20)) ** 2 - 1.25 ** 2 * math.pi
    elif 0.33 <= t % 200 < math.sqrt(6) - 0.33:
        A_s = 0.7 ** 2 * math.pi
    elif math.sqrt(6) - 0.33 <= t % 200 < math.sqrt(6):
        A_s = math.pi * (1.25 + (H(math.sqrt(6)-t)) * math.tan(math.pi / 20)) ** 2 - 1.25 ** 2 * math.pi
    else:
        A_s = 0

while t <= 2.45:
    H(t)
    Aj(t)
    A_list.append(A_s)
    t = t + t_

x_np_list = np.arange(0, len(A_list) * 0.01, 0.01)  # 时间轴表示
plt.xlabel('时间(ms)')
plt.ylabel('面积(mm2)')
plt.plot(x_np_list, A_list, label='实际流出面积', color='#1E90FF')
plt.legend()
plt.show()
复杂模型
高压油管内压力变化
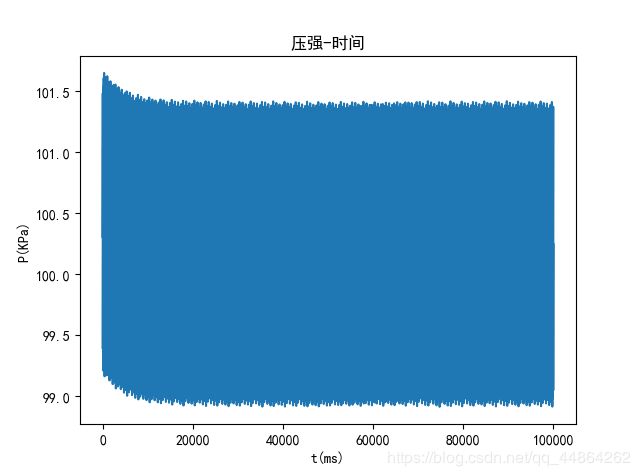
将问题二的进气状态与喷气状态结合, ω = 0.027 ω = 0.027 ω=0.027效果较好,模型能够稳定在 100 M P a 100MPa 100MPa附近。
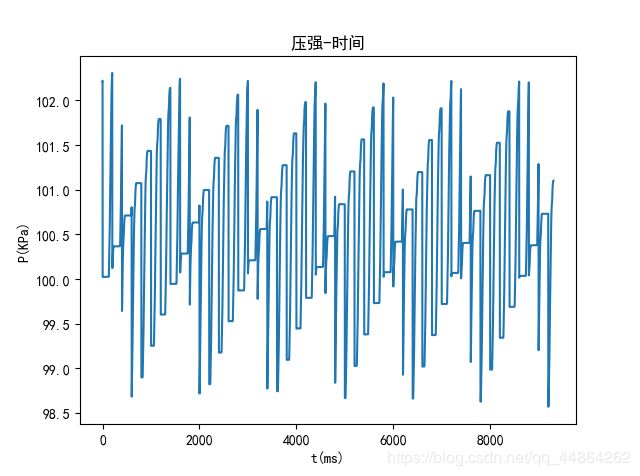
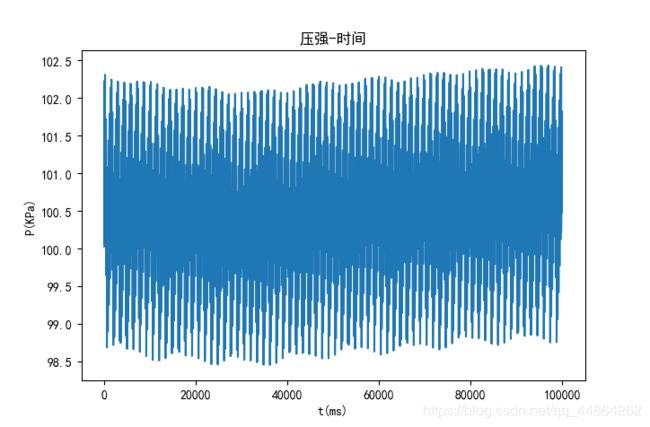
测试代码(参数调整)
import numpy as np
import pandas as pd
import matplotlib.pyplot as plt
import math

data = '附件3-弹性模量与压力.xlsx'
data = pd.read_excel('附件3-弹性模量与压力.xlsx')  # 导入附件3数据
plt.rcParams['font.sans-serif'] = ['SimHei']  # 用来正常显示中文标签
plt.rcParams['axes.unicode_minus'] = False  # 用来正常显示负号
x_pandas_list = data[u'燃油密度(mm3/ms)']  # 附件3 燃油密度列数据
y_pandas_list = data[u'压力(MPa)']  # 附件3 压力列数据
coefficient1_numpy_list = np.polyfit(x_pandas_list, y_pandas_list,
                                     2)  # [ 10784.65349198 -15693.86029255   5648.09019803]y=压强 x=密度拟合系数


def ρ_P(x):  # 密度转压力函数
    return coefficient1_numpy_list[0] * x ** 2 + coefficient1_numpy_list[1] * x + coefficient1_numpy_list[2]


coefficient2_numpy_list = np.polyfit(y_pandas_list, x_pandas_list,
                                     2)  # [-6.59843062e-07  5.23409641e-04  8.04251284e-01]y=密度 x=压强拟合系数


def P_ρ(x):  # 压力转密度函数
    return coefficient2_numpy_list[0] * x ** 2 + coefficient2_numpy_list[1] * x + coefficient2_numpy_list[2]


plt.rcParams['font.sans-serif'] = ['SimHei']  # 用来正常显示中文标签
plt.rcParams['axes.unicode_minus'] = False  # 用来正常显示负号
data = '附件1-凸轮边缘曲线.xlsx'
data = pd.read_excel(data)

x_pandas_list1 = data[u'极角(rad)']
y_pandas_list1 = data[u'极径(mm)']

cof = np.polyfit(x_pandas_list1, y_pandas_list1, 6)  # 凸轮 x-极角 y-极径拟合系数


def y_(x):
    return cof[0] * x ** 6 + cof[1] * x ** 5 + cof[2] * x ** 4 + cof[3] * x ** 3 + cof[4] * x ** 2 + cof[5] * x + cof[6]


ω = 0.027  # 弧度制下的角速度rad/ms
T = 2 * math.pi / ω  # 凸轮运动周期时间 单位ms
t_ = 0.1  # 每隔0.01ms时间段刷新一次状态
α0 = 0  # 初始时刻凸轮旋转角度0
α = α0  # 记录凸轮旋转角度时刻
t = 0  # 记录时刻
H_list = []  # 记录每一时刻活塞距离腔底部的位置
ρ_list = []  # 记录每一时刻活塞距离腔底部的密度
P_list = []  # 记录每一时刻活塞距离腔底部的压力

hMax = 0  # 记录每一时刻高度的最大值
P_camj = 0.5  # 初始时刻压力
ρ_camj = P_ρ(0.5)  # 初始时刻密度
d_camj = 5  # 柱塞腔直径5mm
r_camj = d_camj / 2  # 柱塞腔半径2.5mm
s_camj = math.pi * r_camj ** 2
v_part = 20  # 向上残余容积为20mm3
h_part = v_part / s_camj  # 向上残余高度
m0_camj = 92.4217168684373  # 初始时刻柱塞腔油气质量
m_camj = m0_camj  # 每一时刻柱塞腔油气质量

C = 0.85  # 流量系数

d_a = 1.4  # 小孔处的直径1.4mm
r_a = d_a / 2  # 小孔处的半径1.4mm
A = S_a = math.pi * r_a ** 2  # 小孔处的面积1.5393804002589984mm2

l_primary = 500  # 内腔长度500mm
d_primary = 10  # 内腔直径10mm
r_primary = d_primary / 2  # 内腔半径5mm
S_primary = math.pi * r_primary ** 2  # 内腔横截面积78.53981633974483mm2
V_primary = S_primary * l_primary  # 内腔体积39269.90816987242mm3

ρ0 = 0.85  # 初始100MPa压力下的密度
ρ160 = P_ρ(160)  # 160MPa压力下的密度 0.8711048440368855mg/mm3
m0 = ρ0 * V_primary  # 初始高压油管油气33379.42194439156mg

t = 0  # 记录时刻
t_ = 0.01  # 每隔0.01ms时间段刷新一次状态
m = m0  # 记录每一时刻高压油管内的质量 初始为m0
P = 100  # 记录每一时刻高压油管内的压强
ρ = 0.85  # 录每一时刻高压油管内的密度
P_list = []  # 压强时刻表


def cam_h(t):  # x为时刻 返回值为活塞距离柱塞腔底部的高度
    global α, hMax  # 全局变量可做修改
    hmax = 0  # 记录这一时刻下活塞向上运动的最大值
    for i in np.arange(0, 2 * math.pi, 0.1):  # 弧度制遍历
        h_point = y_(i) * math.cos(ω * t + i)  # 每一时间点下不同弧度坐标位置 h_point y坐标
        if h_point > hmax:  # 把每一个极角遍历出的最大值传递给hmax
            hmax = h_point
            hMax = 7.247588972988529 - hmax + h_part
    return hMax


def P_cam(t):  # 柱塞腔返回t时刻下的压力
    return ρ_P(ρ_cam(t))


def ρ_cam(t):  # 柱塞腔返回t时刻下燃油的密度
    global m_camj, ρ_camj, P_camj
    if t % T <= T / 2:
        m_camj = m0_camj
        P_camj = 0.5
    else:
        if P_camj <= 100:
            ρ_camj = m_camj / (s_camj * cam_h(t))  # 更新密度
            P_camj = ρ_P(ρ_camj)  # 更新压强
        else:
            det_m = C * A * math.sqrt(2 * (P_camj - 100) / ρ_camj) * ρ_camj * t_
            m_camj = m_camj - det_m
            ρ_camj = m_camj / (s_camj * cam_h(t))  # 更新密度
            P_camj = ρ_P(ρ_camj)  # 更新压强


P_list = []  # 压强时刻表


# 进油函数 参数t为时刻
def enter(t):
    global m, P, ρ  # 全局变量,可做修改
    print(t)
    if P_camj > 100.1769:
        Q = C * A * math.sqrt(2 * (P_camj - 100.1769) / P_ρ(P_camj))  # 单位时间进油量
        det_m = Q * P_ρ(P_camj) * t_  # 0.01为步长 质量改变量
        m = m + det_m  # 更新质量
        rou = m / V_primary  # 更新密度
        P = ρ_P(rou)  # 更新压强
    else:
        pass


# 针阀拟合

data = '附件2-针阀运动曲线.xlsx'
data = pd.read_excel('附件2-针阀运动曲线.xlsx')  # 导入附件3数据
plt.rcParams['font.sans-serif'] = ['SimHei']  # 用来正常显示中文标签
plt.rcParams['axes.unicode_minus'] = False  # 用来正常显示负号
x_pandas_list = data[u'时间(ms)']  # 附件2 时间数据
y_pandas_list = data[u'距离(mm)']  # 附件2 距离数据

y1_pandas_list = y_pandas_list[0:46]
x1_pandas_list = x_pandas_list[0:46]
cof1 = np.polyfit(x1_pandas_list, y1_pandas_list, 6)  # 第一段分段函数系数[15.39735971 -1.93086567  0.026043  ]

y2_pandas_list = y_pandas_list[200:246]
x2_pandas_list = x_pandas_list[200:246]
cof2 = np.polyfit(x2_pandas_list, y2_pandas_list, 6)  # 第三段分段函数系数[ 15.44372154 -73.71211028  87.92142494]
A_s = 0


def H(t):
    if 0 < t % 200 <= 0.45:
        return cof1[0] * (t % 200) ** 6 + cof1[1] * (t % 200) ** 5 + cof1[2] * (t % 200) ** 4 + cof1[3] \
               * (t % 200) ** 3 + cof1[4] * (t % 200) ** 2 + cof1[5] * (t % 200) + cof1[6]
    elif 0.45 < t % 200 < 2:
        return 2
    elif 2 <= t % 200 < 2.45:
        return cof2[0] * (t % 200) ** 6 + cof2[1] * (t % 200) ** 5 + cof2[2] * (t % 200) ** 4 + cof2[3] \
               * (t % 200) ** 3 + cof2[4] * (t % 200) ** 2 + cof2[5] * (t % 200) + cof2[6]
    else:
        return 0


def Aj(t):  # 阻塞模型下的流出面积
    global A_s
    if t % 200 < 0.33:
        A_s = math.pi * (1.25 + H(t) * math.tan(math.pi / 20)) ** 2 - 1.25 ** 2 * math.pi
    elif 0.33 <= t % 200 < math.sqrt(6) - 0.33:
        A_s = 0.7 ** 2 * math.pi
    elif math.sqrt(6) - 0.33 <= t % 200 < math.sqrt(6):
        A_s = math.pi * (1.25 + (H(math.sqrt(6) - t)) * math.tan(math.pi / 20)) ** 2 - 1.25 ** 2 * math.pi
    else:
        A_s = 0


def out(t):
    global m, P, ρ_camj  # 全局变量,可做修改
    Q = C * A_s * math.sqrt(2 * P / ρ_camj)  # 单位时间进油量
    det_m = Q * ρ_camj * t_  # 0.01为步长 质量改变量
    m = m - det_m  # 更新质量
    ρ_camj = m / V_primary  # 更新密度
    P = ρ_P(ρ_camj)  # 更新压强


while t <= 40 * T:  # 遍历凸轮旋转一个周期 遍历单位为t_可以自行设计 #ρ_cam(t) enter(t)      Aj(t) out(t)
    t = t + t_
    ρ_cam(t)
    enter(t)
    Aj(t)
    out(t)
    P_list.append(P + 2)

len_P_list = len(P_list)  # 长度为设值遍历长度个
x_numpy_list = np.arange(0, len_P_list * t_, t_)  # 每隔0.01ms列一个x坐标与P_list对应

plt.plot(x_numpy_list, P_list)
plt.title('压强-时间')
plt.xlabel('t(ms)')
plt.ylabel('P(KPa)')
plt.show()
上述代码未做优化遍历工作,实际应用还要遍历求最优值,程序跑起来较慢,可以先拟定一个初始值检测情况,再用比较良好的初始值在附近进行遍历求解。
问题三
两个喷油嘴模型
增加一个喷油嘴,相比于问题二喷出气体的质量会增加,所以需要适当提高角速度,才能保持高压油管内压力稳定。调整参数
第一个喷油嘴开始后的 50 m s 50ms 50ms,第二个喷油嘴开启凸轮角速度调整为 ω = 0.0502 ω = 0.0502 ω=0.0502。

代码实现
import numpy as np
import pandas as pd
import matplotlib.pyplot as plt
import math

data = '附件3-弹性模量与压力.xlsx'
data = pd.read_excel('附件3-弹性模量与压力.xlsx')  # 导入附件3数据
plt.rcParams['font.sans-serif'] = ['SimHei']  # 用来正常显示中文标签
plt.rcParams['axes.unicode_minus'] = False  # 用来正常显示负号
x_pandas_list = data[u'燃油密度(mm3/ms)']  # 附件3 燃油密度列数据
y_pandas_list = data[u'压力(MPa)']  # 附件3 压力列数据
coefficient1_numpy_list = np.polyfit(x_pandas_list, y_pandas_list,
                                     2)  # [ 10784.65349198 -15693.86029255   5648.09019803]y=压强 x=密度拟合系数


def ρ_P(x):  # 密度转压力函数
    return coefficient1_numpy_list[0] * x ** 2 + coefficient1_numpy_list[1] * x + coefficient1_numpy_list[2]


coefficient2_numpy_list = np.polyfit(y_pandas_list, x_pandas_list,
                                     2)  # [-6.59843062e-07  5.23409641e-04  8.04251284e-01]y=密度 x=压强拟合系数


def P_ρ(x):  # 压力转密度函数
    return coefficient2_numpy_list[0] * x ** 2 + coefficient2_numpy_list[1] * x + coefficient2_numpy_list[2]


plt.rcParams['font.sans-serif'] = ['SimHei']  # 用来正常显示中文标签
plt.rcParams['axes.unicode_minus'] = False  # 用来正常显示负号
data = '附件1-凸轮边缘曲线.xlsx'
data = pd.read_excel(data)

x_pandas_list1 = data[u'极角(rad)']
y_pandas_list1 = data[u'极径(mm)']

cof = np.polyfit(x_pandas_list1, y_pandas_list1, 6)  # 凸轮 x-极角 y-极径拟合系数


def y_(x):
    return cof[0] * x ** 6 + cof[1] * x ** 5 + cof[2] * x ** 4 + cof[3] * x ** 3 + cof[4] * x ** 2 + cof[5] * x + cof[6]


ω = 0.0502  # 弧度制下的角速度rad/ms
T = 2 * math.pi / ω  # 凸轮运动周期时间 单位ms
t = 0  # 记录时刻
t_ = 0.1  # 每隔0.01ms时间段刷新一次状态
α0 = 0  # 初始时刻凸轮旋转角度0
α = α0  # 记录凸轮旋转角度时刻

hMax = 0  # 记录每一时刻高度的最大值
P_camj = 0.5  # 初始时刻压力
ρ_camj = P_ρ(0.5)  # 初始时刻密度
d_camj = 5  # 柱塞腔直径5mm
r_camj = d_camj / 2  # 柱塞腔半径2.5mm
s_camj = math.pi * r_camj ** 2
v_part = 20  # 向上残余容积为20mm3
h_part = v_part / s_camj  # 向上残余高度
m0_camj = 92.4217168684373  # 初始时刻柱塞腔油气质量
m_camj = m0_camj  # 每一时刻柱塞腔油气质量

C = 0.85  # 流量系数

d_a = 1.4  # 小孔处的直径1.4mm
r_a = d_a / 2  # 小孔处的半径1.4mm
A = S_a = math.pi * r_a ** 2  # 小孔处的面积1.5393804002589984mm2

l_primary = 500  # 内腔长度500mm
d_primary = 10  # 内腔直径10mm
r_primary = d_primary / 2  # 内腔半径5mm
S_primary = math.pi * r_primary ** 2  # 内腔横截面积78.53981633974483mm2
V_primary = S_primary * l_primary  # 内腔体积39269.90816987242mm3

ρ0 = 0.85  # 初始100MPa压力下的密度
ρ160 = P_ρ(160)  # 160MPa压力下的密度 0.8711048440368855mg/mm3
m0 = ρ0 * V_primary  # 初始高压油管油气33379.42194439156mg

m = m0  # 记录每一时刻高压油管内的质量 初始为m0
P = 100  # 记录每一时刻高压油管内的压强
ρ = 0.85  # 录每一时刻高压油管内的密度
P_list = []  # 压强时刻表


def cam_h(t):  # x为时刻 返回值为活塞距离柱塞腔底部的高度
    global α, hMax  # 全局变量可做修改
    hmax = 0  # 记录这一时刻下活塞向上运动的最大值
    for i in np.arange(0, 2 * math.pi, 0.1):  # 弧度制遍历
        h_point = y_(i) * math.cos(ω * t + i)  # 每一时间点下不同弧度坐标位置 h_point y坐标
        if h_point > hmax:  # 把每一个极角遍历出的最大值传递给hmax
            hmax = h_point
            hMax = 7.247588972988529 - hmax + h_part
    return hMax


def P_cam(t):  # 柱塞腔返回t时刻下的压力
    return ρ_P(ρ_cam(t))


def ρ_cam(t):  # 柱塞腔返回t时刻下燃油的密度
    global m_camj, ρ_camj, P_camj
    if t % T <= T / 2:
        m_camj = m0_camj
        P_camj = 0.5
    else:
        if P_camj <= 100:
            ρ_camj = m_camj / (s_camj * cam_h(t))  # 更新密度
            P_camj = ρ_P(ρ_camj)  # 更新压强
        else:
            det_m = C * A * math.sqrt(2 * (P_camj - 100) / ρ_camj) * ρ_camj * t_
            m_camj = m_camj - det_m
            ρ_camj = m_camj / (s_camj * cam_h(t))  # 更新密度
            P_camj = ρ_P(ρ_camj)  # 更新压强


P_list = []  # 压强时刻表


# 进油函数 参数t为时刻
def enter(t):
    global m, P, ρ  # 全局变量,可做修改
    print(t)
    if P_camj > 100.1769:
        Q = C * A * math.sqrt(2 * (P_camj - 100.1769) / P_ρ(P_camj))  # 单位时间进油量
        det_m = Q * P_ρ(P_camj) * t_  # 0.01为步长 质量改变量
        m = m + det_m  # 更新质量
        rou = m / V_primary  # 更新密度
        P = ρ_P(rou)  # 更新压强
    else:
        pass


# 针阀拟合

data = '附件2-针阀运动曲线.xlsx'
data = pd.read_excel('附件2-针阀运动曲线.xlsx')  # 导入附件3数据
plt.rcParams['font.sans-serif'] = ['SimHei']  # 用来正常显示中文标签
plt.rcParams['axes.unicode_minus'] = False  # 用来正常显示负号
x_pandas_list = data[u'时间(ms)']  # 附件2 时间数据
y_pandas_list = data[u'距离(mm)']  # 附件2 距离数据

y1_pandas_list = y_pandas_list[0:46]
x1_pandas_list = x_pandas_list[0:46]
cof1 = np.polyfit(x1_pandas_list, y1_pandas_list, 6)  # 第一段分段函数系数[15.39735971 -1.93086567  0.026043  ]

y2_pandas_list = y_pandas_list[200:246]
x2_pandas_list = x_pandas_list[200:246]
cof2 = np.polyfit(x2_pandas_list, y2_pandas_list, 6)  # 第三段分段函数系数[ 15.44372154 -73.71211028  87.92142494]
A_s = 0


def H(t):
    if 0 < t % 200 <= 0.45:
        return cof1[0] * (t % 200) ** 6 + cof1[1] * (t % 200) ** 5 + cof1[2] * (t % 200) ** 4 + cof1[3] \
               * (t % 200) ** 3 + cof1[4] * (t % 200) ** 2 + cof1[5] * (t % 200) + cof1[6]
    elif 0.45 < t % 200 < 2:
        return 2
    elif 2 <= t % 200 < 2.45:
        return cof2[0] * (t % 200) ** 6 + cof2[1] * (t % 200) ** 5 + cof2[2] * (t % 200) ** 4 + cof2[3] \
               * (t % 200) ** 3 + cof2[4] * (t % 200) ** 2 + cof2[5] * (t % 200) + cof2[6]
    else:
        return 0


def Aj_1(t):  # 阻塞模型下的流出面积
    global A_s
    if t % 200 < 0.33:
        A_s = math.pi * (1.25 + H(t) * math.tan(math.pi / 20)) ** 2 - 1.25 ** 2 * math.pi
    elif 0.33 <= t % 200 < math.sqrt(6) - 0.33:
        A_s = 0.7 ** 2 * math.pi
    elif math.sqrt(6) - 0.33 <= t % 200 < math.sqrt(6):
        A_s = math.pi * (1.25 + (H(math.sqrt(6) - t)) * math.tan(math.pi / 20)) ** 2 - 1.25 ** 2 * math.pi
    else:
        A_s = 0


def out_1(t):
    global m, P, ρ_camj  # 全局变量,可做修改
    Q = C * A_s * math.sqrt(2 * P / ρ_camj)  # 单位时间进油量
    det_m = Q * ρ_camj * t_  # 0.01为步长 质量改变量
    m = m - det_m  # 更新质量
    ρ_camj = m / V_primary  # 更新密度
    P = ρ_P(ρ_camj)  # 更新压强


def Aj_2(t):  # 阻塞模型下的流出面积
    global A_s
    if t % 200 < 0.33 + 50:
        A_s = math.pi * (1.25 + H(t) * math.tan(math.pi / 20)) ** 2 - 1.25 ** 2 * math.pi
    elif 0.33 + 50 <= t % 200 < math.sqrt(6) - 0.33 + 50:
        A_s = 0.7 ** 2 * math.pi
    elif math.sqrt(6) - 0.33 + 50 <= t % 200 < math.sqrt(6) + 50:
        A_s = math.pi * (1.25 + (H(math.sqrt(6) - t)) * math.tan(math.pi / 20)) ** 2 - 1.25 ** 2 * math.pi
    else:
        A_s = 0


def out_2(t):
    global m, P, ρ_camj  # 全局变量,可做修改
    Q = C * A_s * math.sqrt(2 * P / ρ_camj)  # 单位时间进油量
    det_m = Q * ρ_camj * t_  # 0.01为步长 质量改变量
    m = m - det_m  # 更新质量
    ρ_camj = m / V_primary  # 更新密度
    P = ρ_P(ρ_camj)  # 更新压强


while t <= 10000:  # 遍历凸轮旋转一个周期 遍历单位为t_可以自行设计 #ρ_cam(t) enter(t)      Aj(t) out(t)
    t = t + t_
    ρ_cam(t)
    enter(t)
    Aj_1(t)
    out_1(t)
    Aj_2(t)
    out_2(t)
    P_list.append(P + 4.5)

len_P_list = len(P_list)  # 长度为设值遍历长度个
x_numpy_list = np.arange(0, len_P_list * t_, t_)  # 每隔0.01ms列一个x坐标与P_list对应

plt.plot(x_numpy_list, P_list)
plt.title('压强-时间')
plt.xlabel('t(ms)')
plt.ylabel('P(KPa)')
plt.show()
两个喷油嘴与一个减压阀模型
压力大于102MPa时开启减压阀
这里我觉得是为了防止由于角速度过大而导致高压油管内部的气体压力一直处于上升状态,所以增加了减压阀。适当的把角速度增大并注意压力在某一个时刻开启减压阀。

代码实现
import numpy as np
import pandas as pd
import matplotlib.pyplot as plt
import math

data = '附件3-弹性模量与压力.xlsx'
data = pd.read_excel('附件3-弹性模量与压力.xlsx')  # 导入附件3数据
plt.rcParams['font.sans-serif'] = ['SimHei']  # 用来正常显示中文标签
plt.rcParams['axes.unicode_minus'] = False  # 用来正常显示负号
x_pandas_list = data[u'燃油密度(mm3/ms)']  # 附件3 燃油密度列数据
y_pandas_list = data[u'压力(MPa)']  # 附件3 压力列数据
coefficient1_numpy_list = np.polyfit(x_pandas_list, y_pandas_list,
                                     2)  # [ 10784.65349198 -15693.86029255   5648.09019803]y=压强 x=密度拟合系数


def ρ_P(x):  # 密度转压力函数
    return coefficient1_numpy_list[0] * x ** 2 + coefficient1_numpy_list[1] * x + coefficient1_numpy_list[2]


coefficient2_numpy_list = np.polyfit(y_pandas_list, x_pandas_list,
                                     2)  # [-6.59843062e-07  5.23409641e-04  8.04251284e-01]y=密度 x=压强拟合系数


def P_ρ(x):  # 压力转密度函数
    return coefficient2_numpy_list[0] * x ** 2 + coefficient2_numpy_list[1] * x + coefficient2_numpy_list[2]


plt.rcParams['font.sans-serif'] = ['SimHei']  # 用来正常显示中文标签
plt.rcParams['axes.unicode_minus'] = False  # 用来正常显示负号
data = '附件1-凸轮边缘曲线.xlsx'
data = pd.read_excel(data)

x_pandas_list1 = data[u'极角(rad)']
y_pandas_list1 = data[u'极径(mm)']

cof = np.polyfit(x_pandas_list1, y_pandas_list1, 6)  # 凸轮 x-极角 y-极径拟合系数


def y_(x):
    return cof[0] * x ** 6 + cof[1] * x ** 5 + cof[2] * x ** 4 + cof[3] * x ** 3 + cof[4] * x ** 2 + cof[5] * x + cof[6]


ω = 0.07  # 弧度制下的角速度rad/ms
T = 2 * math.pi / ω  # 凸轮运动周期时间 单位ms
t = 0  # 记录时刻
t_ = 0.1  # 每隔0.01ms时间段刷新一次状态
α0 = 0  # 初始时刻凸轮旋转角度0
α = α0  # 记录凸轮旋转角度时刻

hMax = 0  # 记录每一时刻高度的最大值
P_camj = 0.5  # 初始时刻压力
ρ_camj = P_ρ(0.5)  # 初始时刻密度
d_camj = 5  # 柱塞腔直径5mm
r_camj = d_camj / 2  # 柱塞腔半径2.5mm
s_camj = math.pi * r_camj ** 2
v_part = 20  # 向上残余容积为20mm3
h_part = v_part / s_camj  # 向上残余高度
m0_camj = 92.4217168684373  # 初始时刻柱塞腔油气质量
m_camj = m0_camj  # 每一时刻柱塞腔油气质量

C = 0.85  # 流量系数

d_a = 1.4  # 小孔处的直径1.4mm
r_a = d_a / 2  # 小孔处的半径1.4mm
A = S_a = math.pi * r_a ** 2  # 小孔处的面积1.5393804002589984mm2

l_primary = 500  # 内腔长度500mm
d_primary = 10  # 内腔直径10mm
r_primary = d_primary / 2  # 内腔半径5mm
S_primary = math.pi * r_primary ** 2  # 内腔横截面积78.53981633974483mm2
V_primary = S_primary * l_primary  # 内腔体积39269.90816987242mm3

ρ0 = 0.85  # 初始100MPa压力下的密度
ρ160 = P_ρ(160)  # 160MPa压力下的密度 0.8711048440368855mg/mm3
m0 = ρ0 * V_primary  # 初始高压油管油气33379.42194439156mg

m = m0  # 记录每一时刻高压油管内的质量 初始为m0
P = 100  # 记录每一时刻高压油管内的压强
ρ = 0.85  # 录每一时刻高压油管内的密度
P_list = []  # 压强时刻表


def cam_h(t):  # x为时刻 返回值为活塞距离柱塞腔底部的高度
    global α, hMax  # 全局变量可做修改
    hmax = 0  # 记录这一时刻下活塞向上运动的最大值
    for i in np.arange(0, 2 * math.pi, 0.1):  # 弧度制遍历
        h_point = y_(i) * math.cos(ω * t + i)  # 每一时间点下不同弧度坐标位置 h_point y坐标
        if h_point > hmax:  # 把每一个极角遍历出的最大值传递给hmax
            hmax = h_point
            hMax = 7.247588972988529 - hmax + h_part
    return hMax


def P_cam(t):  # 柱塞腔返回t时刻下的压力
    return ρ_P(ρ_cam(t))


def ρ_cam(t):  # 柱塞腔返回t时刻下燃油的密度
    global m_camj, ρ_camj, P_camj
    if t % T <= T / 2:
        m_camj = m0_camj
        P_camj = 0.5
    else:
        if P_camj <= 100:
            ρ_camj = m_camj / (s_camj * cam_h(t))  # 更新密度
            P_camj = ρ_P(ρ_camj)  # 更新压强
        else:
            det_m = C * A * math.sqrt(2 * (P_camj - 100) / ρ_camj) * ρ_camj * t_
            m_camj = m_camj - det_m
            ρ_camj = m_camj / (s_camj * cam_h(t))  # 更新密度
            P_camj = ρ_P(ρ_camj)  # 更新压强


P_list = []  # 压强时刻表


# 进油函数 参数t为时刻
def enter(t):
    global m, P, ρ  # 全局变量,可做修改
    print(t)
    if P_camj > 100.1769:
        Q = C * A * math.sqrt(2 * (P_camj - 100.1769) / P_ρ(P_camj))  # 单位时间进油量
        det_m = Q * P_ρ(P_camj) * t_  # 0.01为步长 质量改变量
        m = m + det_m  # 更新质量
        rou = m / V_primary  # 更新密度
        P = ρ_P(rou)  # 更新压强
    else:
        pass


# 针阀拟合

data = '附件2-针阀运动曲线.xlsx'
data = pd.read_excel('附件2-针阀运动曲线.xlsx')  # 导入附件3数据
plt.rcParams['font.sans-serif'] = ['SimHei']  # 用来正常显示中文标签
plt.rcParams['axes.unicode_minus'] = False  # 用来正常显示负号
x_pandas_list = data[u'时间(ms)']  # 附件2 时间数据
y_pandas_list = data[u'距离(mm)']  # 附件2 距离数据

y1_pandas_list = y_pandas_list[0:46]
x1_pandas_list = x_pandas_list[0:46]
cof1 = np.polyfit(x1_pandas_list, y1_pandas_list, 6)  # 第一段分段函数系数[15.39735971 -1.93086567  0.026043  ]

y2_pandas_list = y_pandas_list[200:246]
x2_pandas_list = x_pandas_list[200:246]
cof2 = np.polyfit(x2_pandas_list, y2_pandas_list, 6)  # 第三段分段函数系数[ 15.44372154 -73.71211028  87.92142494]
A_s = 0


def H(t):
    if 0 < t % 200 <= 0.45:
        return cof1[0] * (t % 200) ** 6 + cof1[1] * (t % 200) ** 5 + cof1[2] * (t % 200) ** 4 + cof1[3] \
               * (t % 200) ** 3 + cof1[4] * (t % 200) ** 2 + cof1[5] * (t % 200) + cof1[6]
    elif 0.45 < t % 200 < 2:
        return 2
    elif 2 <= t % 200 < 2.45:
        return cof2[0] * (t % 200) ** 6 + cof2[1] * (t % 200) ** 5 + cof2[2] * (t % 200) ** 4 + cof2[3] \
               * (t % 200) ** 3 + cof2[4] * (t % 200) ** 2 + cof2[5] * (t % 200) + cof2[6]
    else:
        return 0


def Aj_1(t):  # 阻塞模型下的流出面积
    global A_s
    if t % 200 < 0.33:
        A_s = math.pi * (1.25 + H(t) * math.tan(math.pi / 20)) ** 2 - 1.25 ** 2 * math.pi
    elif 0.33 <= t % 200 < math.sqrt(6) - 0.33:
        A_s = 0.7 ** 2 * math.pi
    elif math.sqrt(6) - 0.33 <= t % 200 < math.sqrt(6):
        A_s = math.pi * (1.25 + (H(math.sqrt(6) - t)) * math.tan(math.pi / 20)) ** 2 - 1.25 ** 2 * math.pi
    else:
        A_s = 0


def out_1(t):
    global m, P, ρ_camj  # 全局变量,可做修改
    Q = C * A_s * math.sqrt(2 * P / ρ_camj)  # 单位时间进油量
    det_m = Q * ρ_camj * t_  # 0.01为步长 质量改变量
    m = m - det_m  # 更新质量
    ρ_camj = m / V_primary  # 更新密度
    P = ρ_P(ρ_camj)  # 更新压强


def Aj_2(t):  # 阻塞模型下的流出面积
    global A_s
    if t % 200 < 0.33 + 50:
        A_s = math.pi * (1.25 + H(t) * math.tan(math.pi / 20)) ** 2 - 1.25 ** 2 * math.pi
    elif 0.33 + 50 <= t % 200 < math.sqrt(6) - 0.33 + 50:
        A_s = 0.7 ** 2 * math.pi
    elif math.sqrt(6) - 0.33 + 50 <= t % 200 < math.sqrt(6) + 50:
        A_s = math.pi * (1.25 + (H(math.sqrt(6) - t)) * math.tan(math.pi / 20)) ** 2 - 1.25 ** 2 * math.pi
    else:
        A_s = 0


def out_2(t):
    global m, P, ρ_camj  # 全局变量,可做修改
    Q = C * A_s * math.sqrt(2 * P / ρ_camj)  # 单位时间进油量
    det_m = Q * ρ_camj * t_  # 0.01为步长 质量改变量
    m = m - det_m  # 更新质量
    ρ_camj = m / V_primary  # 更新密度
    P = ρ_P(ρ_camj)  # 更新压强


def out_3(t):
    global m, P, ρ_camj  # 全局变量,可做修改
    if P > 102:
        Q = C * 0.49 * math.pi * math.sqrt(2 * P / ρ_camj)  # 单位时间进油量
        det_m = Q * ρ_camj * t_  # 0.01为步长 质量改变量
        m = m - det_m  # 更新质量
        ρ_camj = m / V_primary  # 更新密度
        P = ρ_P(ρ_camj)  # 更新压强


while t <= 2000:  # 遍历凸轮旋转一个周期 遍历单位为t_可以自行设计 #ρ_cam(t) enter(t)      Aj(t) out(t)
    t = t + t_
    ρ_cam(t)
    enter(t)
    Aj_1(t)
    out_1(t)
    Aj_2(t)
    out_2(t)
    out_3(t)
    P_list.append(P)

len_P_list = len(P_list)  # 长度为设值遍历长度个
x_numpy_list = np.arange(0, len_P_list * t_, t_)  # 每隔0.01ms列一个x坐标与P_list对应

plt.plot(x_numpy_list, P_list)
plt.title('压强-时间')
plt.xlabel('t(ms)')
plt.ylabel('P(KPa)')
plt.show()
周期性开启减压阀
刚开始处于上升状态而后逐渐趋于稳定。可以先把不开减压阀的状态图画出来再适当添加减压阀开启的周期,这样进气与出气状态平衡,高压油管内的压力也就自然平衡了。
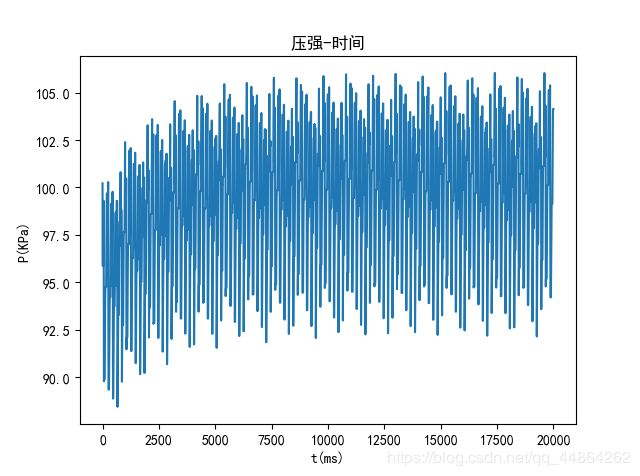
代码实现
import numpy as np
import pandas as pd
import matplotlib.pyplot as plt
import math

data = '附件3-弹性模量与压力.xlsx'
data = pd.read_excel('附件3-弹性模量与压力.xlsx')  # 导入附件3数据
plt.rcParams['font.sans-serif'] = ['SimHei']  # 用来正常显示中文标签
plt.rcParams['axes.unicode_minus'] = False  # 用来正常显示负号
x_pandas_list = data[u'燃油密度(mm3/ms)']  # 附件3 燃油密度列数据
y_pandas_list = data[u'压力(MPa)']  # 附件3 压力列数据
coefficient1_numpy_list = np.polyfit(x_pandas_list, y_pandas_list,
                                     2)  # [ 10784.65349198 -15693.86029255   5648.09019803]y=压强 x=密度拟合系数


def ρ_P(x):  # 密度转压力函数
    return coefficient1_numpy_list[0] * x ** 2 + coefficient1_numpy_list[1] * x + coefficient1_numpy_list[2]


coefficient2_numpy_list = np.polyfit(y_pandas_list, x_pandas_list,
                                     2)  # [-6.59843062e-07  5.23409641e-04  8.04251284e-01]y=密度 x=压强拟合系数


def P_ρ(x):  # 压力转密度函数
    return coefficient2_numpy_list[0] * x ** 2 + coefficient2_numpy_list[1] * x + coefficient2_numpy_list[2]


plt.rcParams['font.sans-serif'] = ['SimHei']  # 用来正常显示中文标签
plt.rcParams['axes.unicode_minus'] = False  # 用来正常显示负号
data = '附件1-凸轮边缘曲线.xlsx'
data = pd.read_excel(data)

x_pandas_list1 = data[u'极角(rad)']
y_pandas_list1 = data[u'极径(mm)']

cof = np.polyfit(x_pandas_list1, y_pandas_list1, 6)  # 凸轮 x-极角 y-极径拟合系数


def y_(x):
    return cof[0] * x ** 6 + cof[1] * x ** 5 + cof[2] * x ** 4 + cof[3] * x ** 3 + cof[4] * x ** 2 + cof[5] * x + cof[6]


ω = 0.100  # 弧度制下的角速度rad/ms
T = 2 * math.pi / ω  # 凸轮运动周期时间 单位ms
t = 0  # 记录时刻
t_ = 0.1  # 每隔0.01ms时间段刷新一次状态
α0 = 0  # 初始时刻凸轮旋转角度0
α = α0  # 记录凸轮旋转角度时刻

hMax = 0  # 记录每一时刻高度的最大值
P_camj = 0.5  # 初始时刻压力
ρ_camj = P_ρ(0.5)  # 初始时刻密度
d_camj = 5  # 柱塞腔直径5mm
r_camj = d_camj / 2  # 柱塞腔半径2.5mm
s_camj = math.pi * r_camj ** 2
v_part = 20  # 向上残余容积为20mm3
h_part = v_part / s_camj  # 向上残余高度
m0_camj = 92.4217168684373  # 初始时刻柱塞腔油气质量
m_camj = m0_camj  # 每一时刻柱塞腔油气质量

C = 0.85  # 流量系数

d_a = 1.4  # 小孔处的直径1.4mm
r_a = d_a / 2  # 小孔处的半径1.4mm
A = S_a = math.pi * r_a ** 2  # 小孔处的面积1.5393804002589984mm2

l_primary = 500  # 内腔长度500mm
d_primary = 10  # 内腔直径10mm
r_primary = d_primary / 2  # 内腔半径5mm
S_primary = math.pi * r_primary ** 2  # 内腔横截面积78.53981633974483mm2
V_primary = S_primary * l_primary  # 内腔体积39269.90816987242mm3

ρ0 = 0.85  # 初始100MPa压力下的密度
ρ160 = P_ρ(160)  # 160MPa压力下的密度 0.8711048440368855mg/mm3
m0 = ρ0 * V_primary  # 初始高压油管油气33379.42194439156mg

m = m0  # 记录每一时刻高压油管内的质量 初始为m0
P = 100  # 记录每一时刻高压油管内的压强
ρ = 0.85  # 录每一时刻高压油管内的密度
P_list = []  # 压强时刻表


def cam_h(t):  # x为时刻 返回值为活塞距离柱塞腔底部的高度
    global α, hMax  # 全局变量可做修改
    hmax = 0  # 记录这一时刻下活塞向上运动的最大值
    for i in np.arange(0, 2 * math.pi, 0.1):  # 弧度制遍历
        h_point = y_(i) * math.cos(ω * t + i)  # 每一时间点下不同弧度坐标位置 h_point y坐标
        if h_point > hmax:  # 把每一个极角遍历出的最大值传递给hmax
            hmax = h_point
            hMax = 7.247588972988529 - hmax + h_part
    return hMax


def P_cam(t):  # 柱塞腔返回t时刻下的压力
    return ρ_P(ρ_cam(t))


def ρ_cam(t):  # 柱塞腔返回t时刻下燃油的密度
    global m_camj, ρ_camj, P_camj
    if t % T <= T / 2:
        m_camj = m0_camj
        P_camj = 0.5
    else:
        if P_camj <= 100:
            ρ_camj = m_camj / (s_camj * cam_h(t))  # 更新密度
            P_camj = ρ_P(ρ_camj)  # 更新压强
        else:
            det_m = C * A * math.sqrt(2 * (P_camj - 100) / ρ_camj) * ρ_camj * t_
            m_camj = m_camj - det_m
            ρ_camj = m_camj / (s_camj * cam_h(t))  # 更新密度
            P_camj = ρ_P(ρ_camj)  # 更新压强


P_list = []  # 压强时刻表


# 进油函数 参数t为时刻
def enter(t):
    global m, P, ρ  # 全局变量,可做修改
    print(t)
    if P_camj > 100.1769:
        Q = C * A * math.sqrt(2 * (P_camj - 100.1769) / P_ρ(P_camj))  # 单位时间进油量
        det_m = Q * P_ρ(P_camj) * t_  # 0.01为步长 质量改变量
        m = m + det_m  # 更新质量
        rou = m / V_primary  # 更新密度
        P = ρ_P(rou)  # 更新压强
    else:
        pass


# 针阀拟合

data = '附件2-针阀运动曲线.xlsx'
data = pd.read_excel('附件2-针阀运动曲线.xlsx')  # 导入附件3数据
plt.rcParams['font.sans-serif'] = ['SimHei']  # 用来正常显示中文标签
plt.rcParams['axes.unicode_minus'] = False  # 用来正常显示负号
x_pandas_list = data[u'时间(ms)']  # 附件2 时间数据
y_pandas_list = data[u'距离(mm)']  # 附件2 距离数据

y1_pandas_list = y_pandas_list[0:46]
x1_pandas_list = x_pandas_list[0:46]
cof1 = np.polyfit(x1_pandas_list, y1_pandas_list, 6)  # 第一段分段函数系数[15.39735971 -1.93086567  0.026043  ]

y2_pandas_list = y_pandas_list[200:246]
x2_pandas_list = x_pandas_list[200:246]
cof2 = np.polyfit(x2_pandas_list, y2_pandas_list, 6)  # 第三段分段函数系数[ 15.44372154 -73.71211028  87.92142494]
A_s = 0


def H(t):
    if 0 < t % 200 <= 0.45:
        return cof1[0] * (t % 200) ** 6 + cof1[1] * (t % 200) ** 5 + cof1[2] * (t % 200) ** 4 + cof1[3] \
               * (t % 200) ** 3 + cof1[4] * (t % 200) ** 2 + cof1[5] * (t % 200) + cof1[6]
    elif 0.45 < t % 200 < 2:
        return 2
    elif 2 <= t % 200 < 2.45:
        return cof2[0] * (t % 200) ** 6 + cof2[1] * (t % 200) ** 5 + cof2[2] * (t % 200) ** 4 + cof2[3] \
               * (t % 200) ** 3 + cof2[4] * (t % 200) ** 2 + cof2[5] * (t % 200) + cof2[6]
    else:
        return 0


def Aj_1(t):  # 阻塞模型下的流出面积
    global A_s
    if t % 200 < 0.33:
        A_s = math.pi * (1.25 + H(t) * math.tan(math.pi / 20)) ** 2 - 1.25 ** 2 * math.pi
    elif 0.33 <= t % 200 < math.sqrt(6) - 0.33:
        A_s = 0.7 ** 2 * math.pi
    elif math.sqrt(6) - 0.33 <= t % 200 < math.sqrt(6):
        A_s = math.pi * (1.25 + (H(math.sqrt(6) - t)) * math.tan(math.pi / 20)) ** 2 - 1.25 ** 2 * math.pi
    else:
        A_s = 0


def out_1(t):
    global m, P, ρ_camj  # 全局变量,可做修改
    Q = C * A_s * math.sqrt(2 * P / ρ_camj)  # 单位时间进油量
    det_m = Q * ρ_camj * t_  # 0.01为步长 质量改变量
    m = m - det_m  # 更新质量
    ρ_camj = m / V_primary  # 更新密度
    P = ρ_P(ρ_camj)  # 更新压强


def Aj_2(t):  # 阻塞模型下的流出面积
    global A_s
    if t % 200 < 0.33 + 50:
        A_s = math.pi * (1.25 + H(t) * math.tan(math.pi / 20)) ** 2 - 1.25 ** 2 * math.pi
    elif 0.33 + 50 <= t % 200 < math.sqrt(6) - 0.33 + 50:
        A_s = 0.7 ** 2 * math.pi
    elif math.sqrt(6) - 0.33 + 50 <= t % 200 < math.sqrt(6) + 50:
        A_s = math.pi * (1.25 + (H(math.sqrt(6) - t)) * math.tan(math.pi / 20)) ** 2 - 1.25 ** 2 * math.pi
    else:
        A_s = 0


def out_2(t):
    global m, P, ρ_camj  # 全局变量,可做修改
    Q = C * A_s * math.sqrt(2 * P / ρ_camj)  # 单位时间进油量
    det_m = Q * ρ_camj * t_  # 0.01为步长 质量改变量
    m = m - det_m  # 更新质量
    ρ_camj = m / V_primary  # 更新密度
    P = ρ_P(ρ_camj)  # 更新压强


def out_3(t):
    global m, P, ρ_camj  # 全局变量,可做修改
    if 50 <= t % 200 < 10 + 50:
        Q = C * 0.49 * math.pi * math.sqrt(2 * P / ρ_camj)  # 单位时间进油量
        det_m = Q * ρ_camj * t_  # 0.01为步长 质量改变量
        m = m - det_m  # 更新质量
        ρ_camj = m / V_primary  # 更新密度
        P = ρ_P(ρ_camj)  # 更新压强


while t <= 20000:  # 遍历凸轮旋转一个周期 遍历单位为t_可以自行设计 #ρ_cam(t) enter(t)      Aj(t) out(t)
    t = t + t_
    ρ_cam(t)
    enter(t)
    Aj_1(t)
    out_1(t)
    out_2(t)
    out_3(t)
    P_list.append(P)

len_P_list = len(P_list)  # 长度为设值遍历长度个
x_numpy_list = np.arange(0, len_P_list * t_, t_)  # 每隔0.01ms列一个x坐标与P_list对应

plt.plot(x_numpy_list, P_list)
plt.title('压强-时间')
plt.xlabel('t(ms)')
plt.ylabel('P(KPa)')
plt.show()
本题代码复用过程较多,设置变量时要记清。第二问可以嵌套第一问的代码,第三问更是在第二问的基础上进行代码的更改,嵌套是一个很重要的过程。第三问参数设置比较丰富,根据自己实际需求设置即可求得最终解。这里所有的 P y t h o n Python Python代码我都已经整理到了压缩包中分享,直接运行即可,链接:https://pan.baidu.com/s/1TZ-C3Ys66bIT6qLVlyTQDQ,需要请留言。
