python matplotlib数据可视化(五)(patches绘制几何图形,圆,矩形,圆弧,楔形)
目录
- 使用模块化patches绘制几何图形
- 圆的实现方法
- 椭圆的实现方法
- 矩形的实现方法
- 圆弧和楔形的绘制方法
- 详解1:
- 详解2:
- 补充详解3:
使用模块化patches绘制几何图形
圆的实现方法
# 导入包
import matplotlib.pyplot as plt
from matplotlib.patches import Circle
import numpy as np

# 绘图
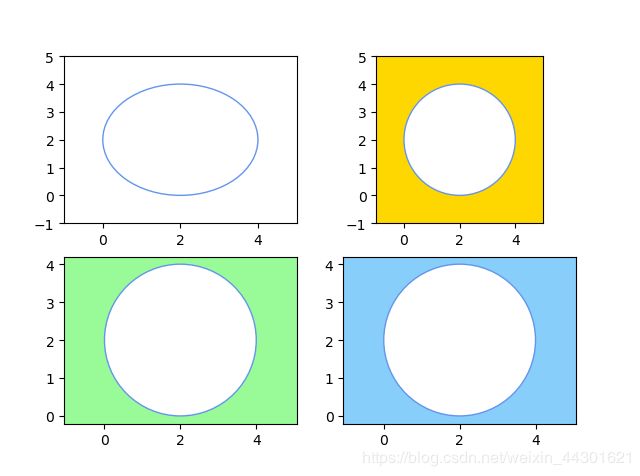
fig,ax = plt.subplots(2,2)

# 子图(221)
circle=Circle((2,2),radius=2,facecolor='white',edgecolor='cornflowerblue')
# (2,2)圆心坐标,radius圆的半径,facecolor圆的填充颜色,edgecolor圆的轮廓颜色
ax[0,0].add_patch(circle)
# 调用实例方法add_patch()将实例circle以参数值形式添加到坐标轴实例ax[0,0]中,从而完成指定位置和半径的圆的绘制
ax[0,0].set_xlim(-1,5)
ax[0,0].set_ylim(-1,5)
# 调用实例调整x,y轴的坐标轴显示范围

# 子图(222)
rectangle=ax[0,1].patch
rectangle.set_facecolor('gold')
# 调用rectangle的实例方法set_facecolor()设置子区坐标轴的背景色
circle=Circle((2,2),radius=2,facecolor='white',edgecolor='cornflowerblue')
ax[0,1].add_patch(circle)
ax[0,1].set_xlim(-1,5)
ax[0,1].set_ylim(-1,5)
ax[0,1].set_aspect('equal','box')
# (221)子图中,圆呈现出椭圆形,是由于x,y轴的刻度线的变化量不同,采用ax[0,1].set_aspect('equal','box')使其相同

# 子图(223)
rectangle=ax[1,0].patch
# 通过ax.patch语句来获得rectangle的实例
rectangle.set_facecolor('palegreen')
circle=Circle((2,2),radius=2,facecolor='white',edgecolor='cornflowerblue')
ax[1,0].add_patch(circle)
ax[1,0].axis('equal')
# 相比(222)将刻度线的变化量进行调整,使之保持相同的增量,不进行x,y轴的坐标轴显示范围的操作

# 子图(224)
rectangle=ax[1,1].patch
rectangle.set_facecolor('lightskyblue')
circle=Circle((2,2),radius=2,facecolor='white',edgecolor='cornflowerblue')
ax[1,1].add_patch(circle)
ax[1,1].axis([-1,5,-1,5]) # 调整x,y轴的坐标轴显示范围
ax[1,1].set_yticks(np.arange(-1,6,1)) # 调整刻度线的位置
ax[1,1].axis('equal') # 调整刻度线的变化量
plt.subplots_adjust(left=0.1) # 调整子图位置

plt.show()
结果如下:

有关plt.subplots_adjust(left=0.1)可以看【Python】matplotlib中pyplot.subplots_adjust参数含义的理解
椭圆的实现方法
# 导入包
import matplotlib.pyplot as plt
from matplotlib.patches import Ellipse
import numpy as np

# 绘图
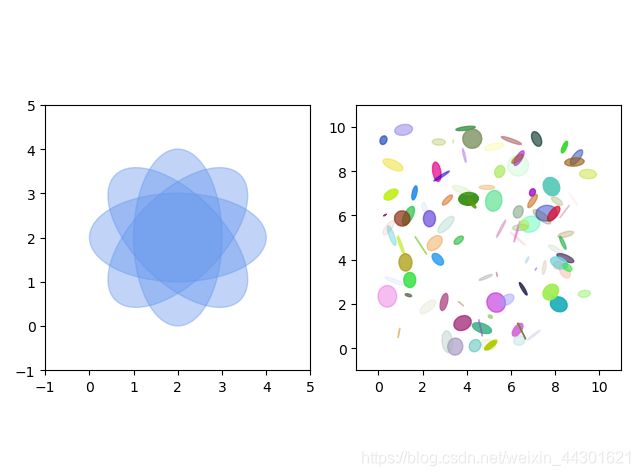
fig,ax = plt.subplots(1,2,subplot_kw={'aspect':'equal'})

# 子图(121)
angles=np.linspace(0,135,4) # 获取四个旋转角度的数组
ellipse=[Ellipse((2,2),4,2,a)for a in angles]
# 获得逆时针旋转4个角度的椭圆实例列表,这是一个推导列表
for elle in ellipse:
    ax[0].add_patch(elle)
    elle.set_alpha(0.4)
    elle.set_color('cornflowerblue')
# 通过for循环,将椭圆实例分别添加到子区1中的坐标轴实例ax[0]中
# 同时使用set.alpha()和set.color()设置椭圆实例的透明度及填充颜色
ax[0].axis([-1,5,-1,5]) # 调整坐标轴的显示范围

# 子图(222)见补充详解3
num=np.arange(0,100,1)
ellipse=[Ellipse(xy=np.random.rand(2)*10,
                 width=np.random.rand(1),
                 height=np.random.rand(1),
                 angle=np.random.rand(1)*360)
                 for i in num]
 # 通过推导列表生成了椭圆中心位置、宽度、长度和旋转角度,都是随机设定的椭圆实例列表ellipse()
for elle in ellipse:
    ax[1].add_patch(elle)
    elle.set_alpha(np.random.rand(1))
    elle.set_color(np.random.rand(3))
# 通过for循环,调用实例方法add_patch()将推导列表ellipse中的实例元素添加到坐标轴实例ax[1]中
# 随机设定椭圆实例的透明度和填充颜色,其中填充颜色使用的是0~1闭区间的浮点数形式的RGB元组,即(R,G,B)颜色模式
ax[1].axis([-1,11,-1,11])
plt.tight_layout()

plt.show()
矩形的实现方法
# 导入包
import matplotlib.pyplot as plt
from matplotlib.patches import Rectangle
import numpy as np

# 绘图
fig,ax = plt.subplots(subplot_kw={'aspect':'equal'})
x1=np.arange(1,2.6,0.1)
y1=x1+2

x2=np.arange(2.5,4.1,0.1)
y2=-x2+7

# 设置背景颜色
rectangle=ax.patch
# 通过ax.patch语句来获得rectangle的实例,Rectangle(xy=(0,0),width=1,height=1)
rectangle.set_facecolor('lightskyblue') # 设置坐标轴实例ax的背景色


# 房子
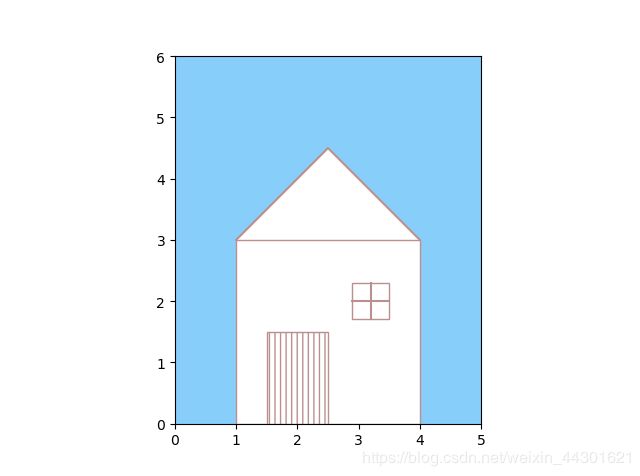
rectangle1=Rectangle((1,0),3,3,facecolor='w',edgecolor='rosybrown')
# 绘制第一个矩形,,矩形左下角顶点坐标(1,0),矩形宽度和高度都是3,,矩形内部填充颜色为白色w,轮廓颜色为棕色

# 门
rectangle2= Rectangle((1.5,0),1,1.5,facecolor='w',edgecolor='rosybrown',hatch='|||')
# 与上面矩形绘制同理,但是添加了hatch='|||',使房子的门产生木质纹理的展示效果

# 窗
rectangle3=Rectangle((2.9,1.7),0.6,0.6,facecolor='w',edgecolor='rosybrown')
rectangle_list=[rectangle1,rectangle2,rectangle3]

# roof line
ax.plot([1,2.5,4],[3,4.5,3],color='rosybrown')
# 绘制房顶三角形区域,[1,2.5,4],[3,4.5,3]分别是x,y的坐标值,也即三个坐标点(1,3)(2.5,4.5)(4,3)

# window line
ax.plot([3.2,3.2],[1.7,2.3],color='rosybrown')
ax.plot([2.9,3.5],[2.0,2.0],color='rosybrown')
# 通过plot()实例方法,向第三个矩形中添加了窗户的窗框,也即是窗户里面的十字形

# roof filled color
ax.fill_between(x1,3,y1,color='w',interpolate=True)
ax.fill_between(x2,3,y2,color='w',interpolate=True)

for rect in rectangle_list:
    ax.add_patch(rect)
# 利用for循环,向画布中添加图像
ax.axis([0,5,0,6])

plt.show()
圆弧和楔形的绘制方法
# 导入包
import matplotlib.pyplot as plt
from matplotlib.patches import Arc,Ellipse,Rectangle,Wedge
import numpy as np

# 绘图
fig,ax = plt.subplots(subplot_kw={'aspect':'equal'})

# shadow,见详解1
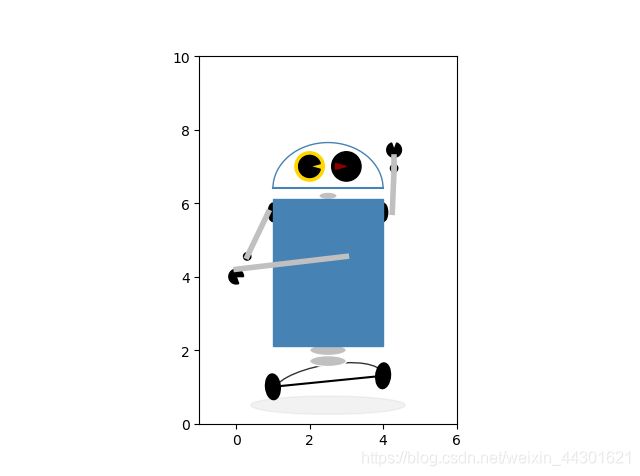
shadow=Ellipse((2.5,0.5),4.2,0.5,color='silver',alpha=0.2)

# base
ax.plot([1,4],[1,1.3],color='k')
base = Arc((2.5, 1.1), 3, 1, angle=10, theta1=0, theta2=180, color='k', alpha=0.8)
# (2.5,1.1)圆弧的中心位置的坐标,3是圆弧的宽度,1是圆弧的高度,angle圆弧逆时针旋转的角度
# theta1圆弧起点处的角度,theta2圆弧终点处的角度,color圆弧的颜色,alpha圆弧的透明度

# wheel
left_wheel=Ellipse((1,1),0.7,0.4,angle=95,color='k')
right_wheel=Ellipse((4,1.3),0.7,0.4,angle=85,color='k')

# jionstyle
bottom_jionstyle1=Ellipse((2.5,2),1,0.3,facecolor='silver',edgecolor='w')
bottom_jionstyle2=Ellipse((2.5,1.7),1,0.3,facecolor='silver',edgecolor='w')
left_jionstyle=Ellipse((1,5.75),0.5,0.25,angle=90,color='k')
left_arm_jionstyle1=Wedge((0.3,4.55),0.1,0,360,color='k')
left_arm_jionstyle2=Wedge((0,4),0.2,0,290,color='k')
right_jionstyle=Ellipse((4,5.75),0.5,0.25,angle=90,color='k')
right_arm_jionstyle1=Wedge((4.3,6.95),0.1,0,360,color='k')
right_arm_jionstyle2=Wedge((4.3,7.45),0.2,110,70,color='k')
top_jionstyle1=Ellipse((2.5,6.2),0.5,0.2,facecolor='silver',edgecolor='w')
top_jionstyle2=Ellipse((2.5,6.2),0.5,0.2,facecolor='silver',edgecolor='w')

# body
body=Rectangle((1,2.1),3,4,color='steelblue')

# arms
left_arm1=ax.plot([0.3,1-0.125],[4.55,5.75],color='silver',lw=4)
left_arm2=ax.plot([0,3],[4.2,4.55],color='silver',lw=4)
right_arm1=ax.plot([4+0.25,4.3],[5.75,6.95],color='silver',lw=4)
right_arm2=ax.plot([4.3,4.3],[6.95,7.25],color='silver',lw=4)

# head
ax.plot([1,4],[6.4,6.4],color='steelblue')
head=Arc((2.5,6.4),3,2.5,angle=0,theta1=0,theta2=180,color='steelblue')

# eyes,见详解2
left_eye=Wedge((2,7),0.4,0,360,color='gold')
left_eye_center=Wedge((2,7),0.3,15,345,color='k')
right_eye=Wedge((3,7),0.4,0,360,color='k')
right_eye_center=Wedge((3,7),0.3,165,195,color='darkred')

polygon=[shadow,
         base,
         left_wheel,
         right_wheel,
         bottom_jionstyle1,
         bottom_jionstyle2,
         left_jionstyle,
         right_jionstyle,
         left_arm_jionstyle1,
         left_arm_jionstyle2,
         right_arm_jionstyle1,
         right_arm_jionstyle2,
         top_jionstyle1,
         top_jionstyle2,
         body,
         head,
         left_eye,
         left_eye_center,
         right_eye,
         right_eye_center,
         ]

for pln in polygon:
    ax.add_patch(pln)
ax.axis([-1,6,0,10])

plt.show()
详解1:
shadow=Ellipse((2.5,0.5),4.2,0.5,color='silver',alpha=0.2)
在解释这段代码的时候,查询了ellipse的用法,不同的包里面,对这个函数用法不同,在这里,(2.5,0.5)是指椭圆的中心点,4.2是指椭圆的长轴,0.5是指椭圆的短轴的长度。
而利用OpenCV绘制椭圆的时候,各参数的书写形式又有所不同,利用PIL绘制椭圆时,也有所差异
详解2:
left_eye=Wedge((2,7),0.4,0,360,color='gold')
left_eye_center=Wedge((2,7),0.3,15,345,color='k')
# 此句绘制机器人左眼的黑色楔形
# (2,7):楔形中心位置坐标;0.3楔形半径;
# 15楔形起始位置的角度;345楔形终止为止角度,旋转角度以x轴正方向为起点,逆时针旋转
# color填充区域颜色
right_eye=Wedge((3,7),0.4,0,360,color='k')
right_eye_center=Wedge((3,7),0.3,165,195,color='darkred')
补充详解3:
有关推导列表的内容
推导列表,也即是生成一个满足特定条件的列表,推导列表中可以用for,可以用if,不能用else,例如:
print([x+1 for x in range(1,10,2)])
结果为:
[2, 4, 6, 8, 10]
上述代码意思是:x在range(1,10,2)内取值,输出x+1的值,
range(1,10,2)的输出结果应为1,3,5,7,9 那么x+1的值就为程序输出内容。
num=np.arange(0,100,1)
ellipse=[Ellipse(xy=np.random.rand(2)*10,
                 width=np.random.rand(1),
                 height=np.random.rand(1),
                 angle=np.random.rand(1)*360)
                 for i in num]
那么,上述这段意思是:i在num内取值,输出(xy=np.random.rand(2)*10,width=np.random.rand(1),
height=np.random.rand(1),angle=np.random.rand(1)*360)的椭圆,该椭圆的中心位置、宽度、长度都是随机产生。
感谢刘大成《matplotlib精进》
暂未解决学习到的疑问点
1.调用实例方法
2.椭圆实现方法ax[2]中提到的推导列表
3.fill_between()实例中填写三个参数,分别代表何意?如矩形的实现方法中绘制房顶部分时使用的between()
4.ax[0,1].set_aspect(‘equal’,‘box’) 以及
fig,ax = plt.subplots(subplot_kw={‘aspect’:‘equal’})
5.有关随机产生可暂时参考这篇文章https://blog.csdn.net/abc13526222160/article/details/86423754
都不太理解其中具体的含义,后续想到了再更新吧,或者再写新文章


