【Spring Cloud】学习教程(五):Hystrix 监控面板 Dashboard【Finchley】
Hystrix 监控面板 Dashboard
- 一、创建 Hystrix Dashboard
- 1.1 POM 配置
- 1.2 启动类
- 1.3 配置文件
- 二、为服务实例添加 endpoint
- 2.1 POM 配置
- 2.2 启动类
- 2.3 配置文件
- 2.4 测试
- 2.5 界面解读
- 参考
在上一篇 Hystrix 的介绍中,我们提到断路器是根据一段时间窗内的请求情况来判断并操作断路器的打开和关闭状态的。而这些请求情况的指标信息都是 HystrixCommand 和 HystrixObservableCommand 实例在执行过程中记录的重要度量信息,它们除了 Hystrix 断路器实现中使用之外,对于系统运维也有非常大的帮助。这些指标信息会以 “滚动时间窗” 与 “桶” 结合的方式进行汇总,并在内存中驻留一段时间,以供内部或外部进行查询使用,Hystrix Dashboard 就是这些指标内容的消费者之一。
下面我们基于之前的示例来结合 Hystrix Dashboard 实现 Hystrix 指标数据的可视化面板,这里我们将用到下之前实现的几个应用,包括:
- eureka-server:服务注册中心
- eureka-producer:服务提供者
- eureka-consumer-feign-hystrix:使用 Feign 和 Hystrix 实现的服务消费者
一、创建 Hystrix Dashboard
创建一个标准的 Spring Boot 工程,命名为:hystrix-dashboard
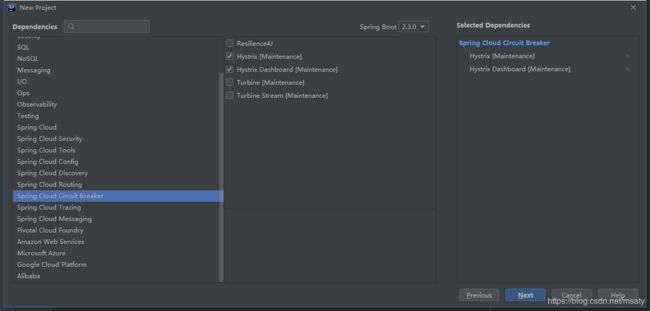
1.1 POM 配置
在 pom.xml 引入相关的依赖
<dependency>
    <groupId>org.springframework.cloudgroupId>
    <artifactId>spring-cloud-starter-netflix-hystrixartifactId>
dependency>
<dependency>
    <groupId>org.springframework.cloudgroupId>
    <artifactId>spring-cloud-starter-netflix-hystrix-dashboardartifactId>
dependency>
1.2 启动类
在 Spring Boot 的启动类上面引入注解 @EnableHystrixDashboard,启用 Hystrix Dashboard 功能。
@EnableHystrixDashboard
@SpringBootApplication
public class HystrixDashboardApplication {

    public static void main(String[] args) {
        SpringApplication.run(HystrixDashboardApplication.class, args);
    }

}
1.3 配置文件
修改配置文件 application.yml
spring:
  application:
    name: hystrix-dashboard
server:
  port: 11000
启动应用,然后再浏览器中输入 http://localhost:11000/hystrix 可以看到如下界面
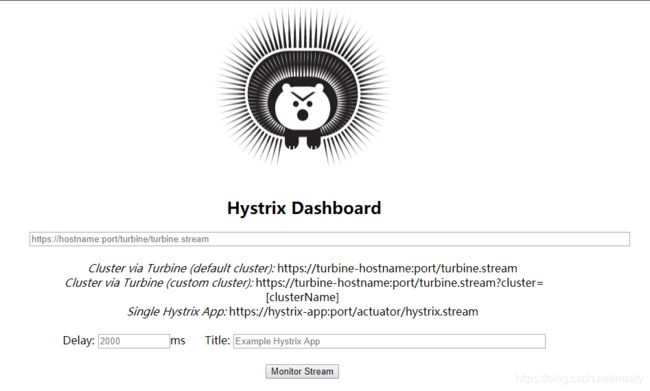
通过 Hystrix Dashboard 主页面的文字介绍,我们可以知道,Hystrix Dashboard 共支持三种不同的监控方式:
默认的集群监控:通过 URL:http://turbine-hostname:port/turbine.stream 开启,实现对默认集群的监控。
指定的集群监控:通过 URL:http://turbine-hostname:port/turbine.stream?cluster=[clusterName] 开启,实现对 clusterName 集群的监控。
单体应用的监控: 通过 URL:https://hystrix-app:port/actuator/hystrix.stream 开启 ,实现对具体某个服务实例的监控。
前两者都对集群的监控,需要整合 Turbine 才能实现,下篇文章实现这个。
此处我们先实现对单体应用的监控,这里的单体应用就用我们之前使用 Feign 和 Hystrix 实现的服务消费者 ——eureka-consumer-feign-hystrix。
页面上的另外两个参数:
- Delay:控制服务器上轮询监控信息的延迟时间,默认为 2000 毫秒,可以通过配置该属性来降低客户端的网络和 CPU 消耗。
- Title:该参数可以展示合适的标题。
二、为服务实例添加 endpoint
既然 Hystrix Dashboard 监控单实例节点需要通过访问实例的 /actuator/hystrix.stream 接口来实现,自然我们需要为服务实例添加这个 endpoint。
此处需要使用eureka-consumer-feign-hystrix。
2.1 POM 配置
在服务实例 pom.xml 中的 dependencies 节点中新增 spring-boot-starter-actuator 监控模块以开启监控相关的端点,并确保已经引入断路器的依赖 spring-cloud-starter-netflix-hystrix
<dependency>
    <groupId>org.springframework.cloudgroupId>
    <artifactId>spring-cloud-starter-netflix-hystrixartifactId>
dependency>
<dependency>
    <groupId>org.springframework.bootgroupId>
    <artifactId>spring-boot-starter-actuatorartifactId>
dependency>
2.2 启动类
为启动类添加 @EnableCircuitBreaker 或 @EnableHystrix 注解,开启断路器功能。
@EnableHystrix
@EnableFeignClients
@SpringBootApplication
public class EurekaConsumerFeignHystrixApplication {

    public static void main(String[] args) {
        SpringApplication.run(EurekaConsumerFeignHystrixApplication.class, args);
    }
}
2.3 配置文件
修改配置文件,在 application.yml 中添加management:
spring:
  application:
    name: eureka-consumer-feign-hystrix
eureka:
  client:
    service-url:
      defaultZone: http://localhost:7000/eureka/
server:
  port: 9004
feign:
  hystrix:
    enabled: true
management:
  endpoints:
    web:
      exposure:
        include: hystrix.stream
management.endpoints.web.exposure.include 这个是用来暴露 endpoints 的。由于 endpoints 中会包含很多敏感信息,除了 health 和 info 两个支持 web 访问外,其他的默认不支持 web 访问。详情请看 50. Endpoints
2.4 测试
在 Hystrix-Dashboard 的主界面上输入 eureka-consumer-feign-hystrix 对应的地址 http://localhost:9004/actuator/hystrix.stream 然后点击 Monitor Stream 按钮,进入页面。
如果没有请求会一直显示 “Loading…”,这时访问 http://localhost:9004/actuator/hystrix.stream 也是不断的显示 “ping”。
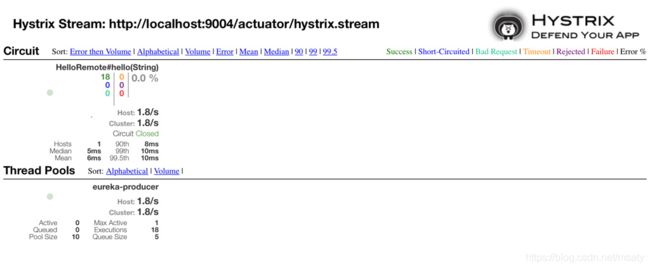
这时候访问一下 http://localhost:9004/hello/?name=luhao,可以看到 Hystrix Dashboard 中出现了类似下面的效果
如果在这个页面看到报错:Unable to connect to Command Metric Stream.,可以参考这个 Issue 解决。
2.5 界面解读

以上图来说明其中各元素的具体含义:
- 实心圆:它有颜色和大小之分,分别代表实例的监控程度和流量大小。如上图所示,它的健康度从绿色、黄色、橙色、红色递减。通过该实心圆的展示,我们就可以在大量的实例中快速的发现故障实例和高压力实例。
- 曲线:用来记录 2 分钟内流量的相对变化,我们可以通过它来观察到流量的上升和下降趋势。
- 其他一些数量指标如下图所示:

到此单个应用的熔断监控已经完成。
参考
springcloud (五):熔断监控 Hystrix Dashboard 和 Turbine
Spring Cloud 构建微服务架构:Hystrix 监控面板【Dalston 版】
Unable to connect to Command Metric Stream