图像可视化——matplotlib绘图入门基础
文章目录
- 1.图片与子图
- 2.调整子图周围的间距
- 3.颜色、标记和线类型
- 4.刻度、标签和图例
- 5.matplotlib设置
1.图片与子图
matplotlib所绘制的图位于图片(figure)对象中,可以使用plt.figure生成一个新的图片
import matplotlib.pyplot as plt
import numpy as np
fig = plt.figure()
使用add_subplot创建一个或多个子图
ax1 = fig.add_subplot(2, 2, 1)
上面的代码意思是将图片分为为2 * 2个(最多4个图形)子图,并且我们选择了4个图形中的第一个图形
将这些代码在同一单元格下运行,当不指定性的输入绘图命令时,会在最后一个子图上绘制
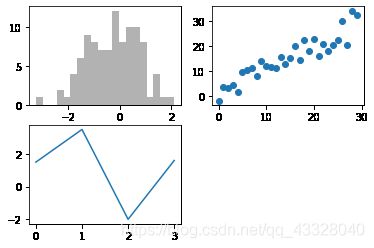
fig = plt.figure()
ax1 = fig.add_subplot(2, 2, 1)
ax2 = fig.add_subplot(2, 2, 2)
ax3 = fig.add_subplot(2, 2, 3)
plt.plot([1.5, 3.5, -2, 1.6]) # 画在最后一个子图上
ax1.hist(np.random.randn(100),bins = 20,color = 'k',alpha = 0.3)
ax2.scatter(np.arange(30),np.arange(30) + 3 * np.random.randn(30))
使用plt.subplot方法,创建一个新的图片,然后返回包含了已生成子图对象的Numpy数组
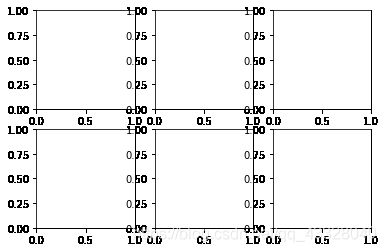
fig,axes = plt.subplots(2,3)
axes
array([[,
        ,
        ],
       [,
        ,
        ]],
      dtype=object)
2.调整子图周围的间距
使用subplots_adjust方法更改间距
subplots_adjust(left = None,bottom = None,right = None,top = None,
           wapace = None,hspace = None)
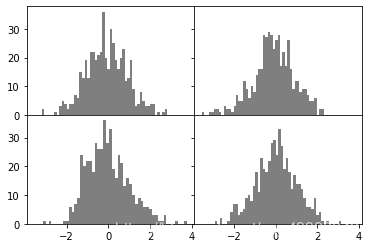
wspace和hspace分别控制图片的宽度和高度的百分比,用作子图间的间距
fig, axes = plt.subplots(2, 2,sharex = True, sharey = True) # 所有子图使用相同的x轴和y轴
for i in range(2):
    for j in range(2):
        axes[i, j].hist(np.random.randn(500), bins = 50, color = 'k', alpha = 0.5)
plt.subplots_adjust(wspace = 0,hspace = 0)
data = np.random.randn(30).cumsum()
data
array([ 1.28099548,  2.75456071,  1.77403079,  2.20068184,  4.93574728,
        5.66352305,  6.65017461,  7.18511111,  5.51788085,  6.17269346,
        6.36293879,  6.34804836,  5.23303741,  4.16573077,  2.31256438,
        3.3868217 ,  3.94358985,  2.37206249,  2.40933918,  2.31372561,
        2.41143179,  3.24563762,  3.19214401,  2.55892644,  4.00963688,
        3.76547399,  1.53796653,  1.43429435, -0.57085528, -0.77787963])
3.颜色、标记和线类型
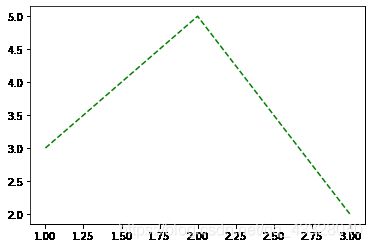
matplotlib主函数plot接收带有x和y轴的数组以及一些可选的字符串参数来指明颜色和线类型
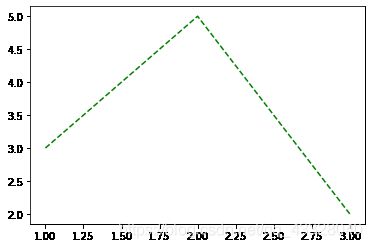
x =[1, 2, 3]
y = [3, 5, 2]
plt.plot(x, y, 'g--')
还可以用更加显示的方法来表达
plt.plot(x, y, linestyle = '--',color = 'g')
plt.plot(np.random.randn(30), 'ko--')
显示写法
plt.plot(np.random.randn(30),color = 'k', linestyle = '--', marker = 'o')
4.刻度、标签和图例
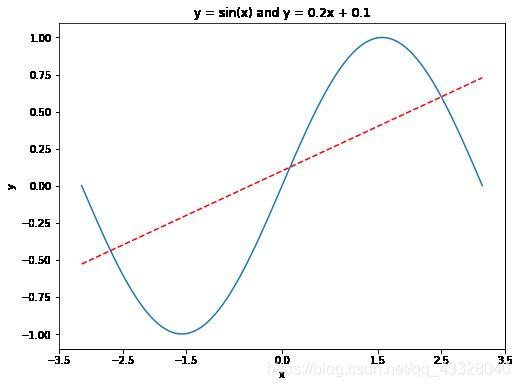
plot接口设计为交互式使用,包含了像xlim、xticks和xticklabels等方法。
分别表示绘图范围,刻度位置以及刻度标签
如:plt.xlim([0, 10]) 会将x轴的范围设置为0到10
使用xlabel和ylabel定义x轴和有轴标签
使用title为图标定义标题
import numpy as np
import matplotlib.pyplot as plt

x = np.linspace(-np.pi, np.pi, 100) # 在区间内生成21个等差数
y = np.sin(x)
linear_y = 0.2 * x + 0.1

plt.figure(figsize = (8, 6)) # 自定义窗口的大小

plt.plot(x, y)
plt.plot(x, linear_y, color = "red", linestyle = '--') # 自定义颜色和表示方式

plt.title('y = sin(x) and y = 0.2x + 0.1') # 定义该曲线的标题

plt.xticks([-3.5,-2.5,-1.5,0,1.5,2.5,3.5]) # 自定义x轴刻度
plt.xlabel('x') # 定义横轴标签
plt.ylabel('y') # 定义纵轴标签

plt.show()
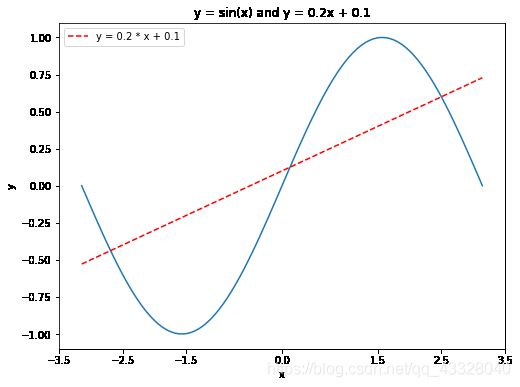
添加图例:
即为图表添加说明性的信息
import numpy as np
import matplotlib.pyplot as plt

x = np.linspace(-np.pi, np.pi, 100) # 在区间内生成21个等差数
y = np.sin(x)
linear_y = 0.2 * x + 0.1

plt.figure(figsize = (8, 6)) # 自定义窗口的大小

plt.plot(x, y)
plt.plot(x, linear_y, color = "red", linestyle = '--',label = 'y = 0.2 * x + 0.1') # 自定义颜色和表示方式

plt.title('y = sin(x) and y = 0.2x + 0.1') # 定义该曲线的标题

plt.xticks([-3.5,-2.5,-1.5,0,1.5,2.5,3.5]) # 自定义x轴刻度
plt.xlabel('x') # 定义横轴标签
plt.ylabel('y') # 定义纵轴标签
plt.legend()  # 显示图例

plt.show()
5.matplotlib设置
matplotlib配置了配色方案和默认设置,这些默认设置都可以用过广泛的全局参数来定制。
使用rc方法是使用python编程修改配置的一种方法,例如,将全局默认数字大小设置为10*10
plt.rc('figure',figsize = (10,10))
rc的第一个参数是你想要自定义的组件,比如’figure’,‘axes’,‘xtick’,'legend’等
可以使用字典来进行设置
font_options = {'family':'monospace',
                'weight':'bold',
                'size':'small'}
plt.rc('font',**font_options)
