机器学习和数据分析-matplotlib绘制柱状图和饼状图
文章目录
- 柱状图
- 饼状图
柱状图
1.启动jupyter notebook
2.创建一个新的notebook,并导入matplotlib
import matplotlib.pyplot as plt
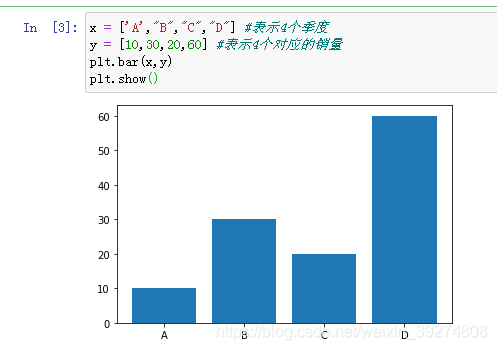
x = ['A',"B","C","D"] #表示4个季度
y = [10,30,20,60] #表示4个对应的销量
plt.bar(x,y)
plt.show()
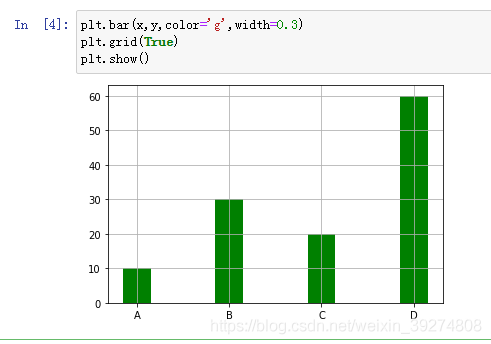
4.指定颜色:color ,指定条形宽度:width , 增加网格:plt.grid(True)
plt.bar(x,y,color='g',width=0.3)
plt.grid(True)
plt.show()
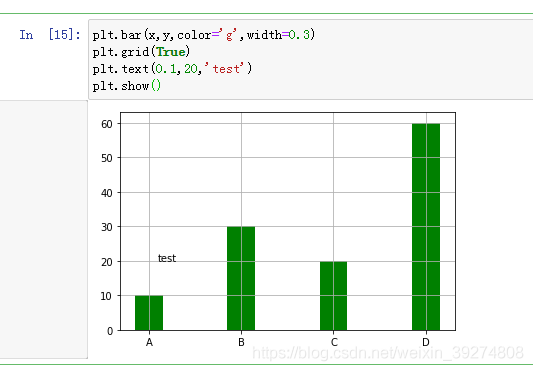
5.在柱状图上面写上数字,使用plt.text()函数,比如plt.text(0.1,20,‘test’)
plt.bar(x,y,color='g',width=0.3)
plt.grid(True)
plt.text(0.1,20,'test')
plt.show()
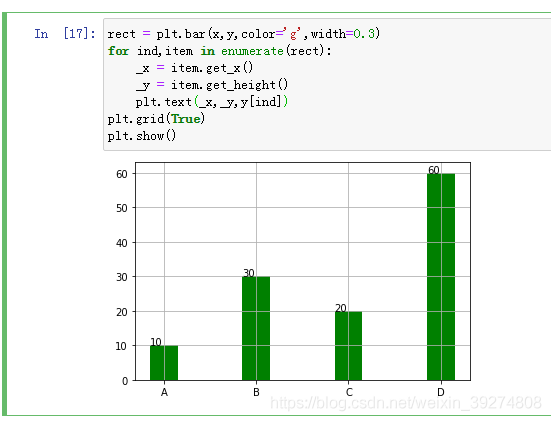
rect = plt.bar(x,y,color='g',width=0.3)
for ind,item in enumerate(rect):
    _x = item.get_x()
    _y = item.get_height()
    plt.text(_x,_y,y[ind])
plt.grid(True)
plt.show()
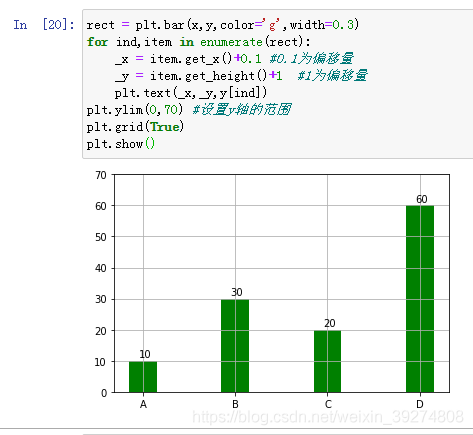
7.为了使数字和柱子没那么紧凑,可以在x轴和y轴上面加上一定偏移量,并且增加y轴的范围,代码如下:
rect = plt.bar(x,y,color='g',width=0.3)
for ind,item in enumerate(rect):
    _x = item.get_x()+0.1 #0.1为偏移量
    _y = item.get_height()+1  #1为偏移量
    plt.text(_x,_y,y[ind])
plt.ylim(0,70) #设置y轴的范围
plt.grid(True)
plt.show()
饼状图
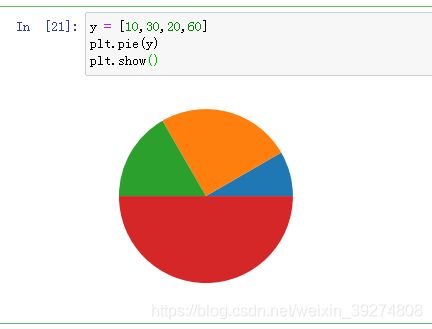
1.绘制一个简单的饼状图,只需要传入一个y值
y = [10,30,20,60]
plt.pie(y)
plt.show()
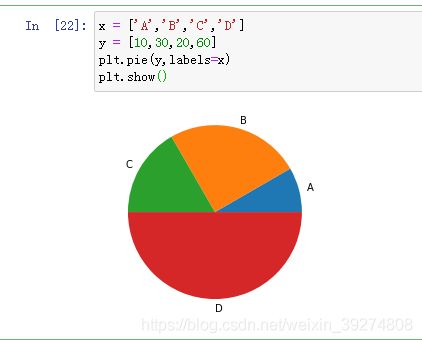
x = ['A','B','C','D']
y = [10,30,20,60]
plt.pie(y,labels=x)
plt.show()
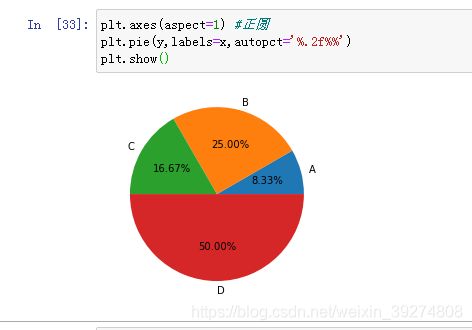
3.在饼状图上面加上百分比,autopct=’%.2f%%’,将默认椭圆改成正圆
plt.axes(aspect=1) #正圆
plt.pie(y,labels=x,autopct='%.2f%%')
plt.show()
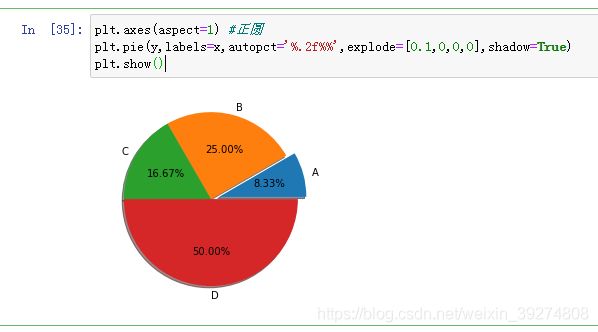
4.突出第一部分,explode = [0.1,0,0,0], 边上加上阴影: shadow=True
plt.axes(aspect=1) #正圆
plt.pie(y,labels=x,autopct='%.2f%%',explode=[0.1,0,0,0],shadow=True)
plt.show()

