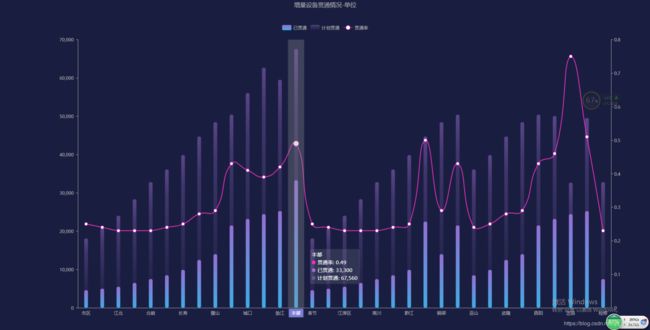
echarts柱形图超炫颜色搭配
var dom = document.getElementById("container");
			// dom.style.height=window.innerHeight+'px';
			var myChart = echarts.init(dom,"westeros");
			var app = {};
			option = null;
			var category = ['螺丝钉','弹簧环','方向盘','轮胎','粉丝','烤肉饭','鸡公煲'
			,'腐竹','圆子','年糕','玉米','米饭','鱼豆腐','羊肉卷','牛肉卷','五花肉','牛柳'
			,'牛排','鸡排','羊排','红烧肉','烧烤'];
			var dottedBase = [];
			var lineData = [18092,20728,24045,28348,32808
			                ,36097,39867,44715,48444,50415
			                ,56061,62677,59521,67560,18092,20728,24045,28348,32808
			                ,36097,39867,44715,48444];
			var barData = [18000,5000,5500,6500,7500
			                ,8500,9900,12500,14000,21500
			                ,23200,24450,25250,33300,4600,5000,5500,6500,7500
			                ,8500,9900,22500,14000];
			var rateData = [];
			32808
			for (var i = 0; i < 33; i++) {
			    // var date = i+2001;
			    // category.push(date)(barData[i]/lineData[i]*100).toFixed(2) +'%'
			    var rate=(barData[i]/lineData[i]).toFixed(2)
				// rate = rate.toFixed(2);
				// rate+="%";
			    rateData[i] = rate;
			}


			// option
			option = {
				// backgroundColor: '#191E40',
			    title: {
			        text: '各产品完成率',
			        x: 'left',
			        y: 0,
			        textStyle:{
			            color:'#ffffff',
			            fontSize:16,
			            fontWeight:'normal',
			        },

			    },
			    tooltip: {
			        trigger: 'axis',
			        backgroundColor:'#5bc0de',
					textStyle:{
					    color:'#ffffff',
					    fontSize:18,
					    fontWeight:'normal',
					},
			        axisPointer: {
			            type: 'shadow',
			            label: {
							fontSize:16,
			                show: true,
			                backgroundColor: '#7B7DDC'
			            }
			        }
			    },
			    legend: {
			        data: ['已产出数量', '计划数量','完成率'],
			        textStyle: {
			            color: '#ffffff'
			        },
			        top:'2%',
			    },
			    grid:{
			        x:'12%',
			        width:'82%',
			        y:'12%',
			    },
			    xAxis: {
			        data: category,
			        axisLine: {
			            lineStyle: {
			                color: '#ffffff'
			            }
			        },
			        axisTick:{
			            show:false,
			        },
			    },
			    yAxis: [{

			        splitLine: {show: false},
			        axisLine: {
			            lineStyle: {
			                color: '#ffffff',
			            }
			        },

			        axisLabel:{
			            formatter:'{value} ',
			        }
			    },
			        {

			        splitLine: {show: false},
			        axisLine: {
			            lineStyle: {
			                color: '#B4B4B4',
			            }
			        },
			        axisLabel:{
			            formatter:'{value} ',
			        }
			    }],

			    series: [
				{
			        name: '完成率',
			        type: 'line',
			        smooth: true,
			        showAllSymbol: true,
			        symbol: 'emptyCircle',
			        symbolSize: 8,
			        yAxisIndex: 1,
			        itemStyle: {
			                normal: {
			                color:'#F02FC2'},
			        },
			        data: rateData
			    },
			    {
			        name: '已产出数量',
			        type: 'bar',
			        barWidth: 15,
			        itemStyle: {
			            normal: {
			                barBorderRadius: 5,
							//颜色渐变
			                color: new echarts.graphic.LinearGradient(
			                    0, 0, 0, 1,
			                    [
			                        {offset: 1, color: '#33cabb'},
			                        {offset: 0, color: '#3EACE5'}
			                    ]
			                )
			            }
			        },
			        data: barData
			        //小提示框
			        label: {
					    normal: {
					        show: true,
					        lineHeight: 30,
					        width: 80,
					        height: 30,
					        backgroundColor: '#252453',
					        borderRadius: 200,
					        position: ['-8', '-60'],
					        distance: 1,
					        formatter: [
					            '    {d|●}',
					            ' {a|{c}}     \n',
					            '    {b|}'
					        ].join(''),
					        rich: {
					            d: {
					                color: '#3CDDCF',
					            },
					            a: {
					                color: '#fff',
					                align: 'center',
					            },
					            b: {
					                width: 1,
					                height: 30,
					                borderWidth: 1,
					                borderColor: '#234e6c',
					                align: 'left'
					            },
					        }
					    }
					},
			    },

			    {
			        name: '计划数量',
			        type: 'bar',
			        barGap: '-100%',
			        barWidth: 15,
			        itemStyle: {
			            normal: {
			                barBorderRadius: 5,
			                color: new echarts.graphic.LinearGradient(
			                    0, 0, 0, 1,
			                    [
			                        {offset: 0, color: 'rgba(156,107,211,1)'},
			                        // {offset: 0.2, color: 'rgba(156,107,211,0.5)'},
			                        {offset: 1, color: 'rgba(156,107,211,0)'}
			                    ]
			                )
			            }
			        },
			        z: -12,

			        data: lineData
			    },
			   ]
			};
				  /* 自动轮换显示 */
			      var app = {
			        currentIndex: -1,
			      };
			      setInterval(function () {
			        var dataLen = option.series[0].data.length;

			        // 取消之前高亮的图形
			        myChart.dispatchAction({
			          type: 'downplay',
			          seriesIndex: 0,
			          dataIndex: app.currentIndex
			        });
			        app.currentIndex = (app.currentIndex + 1) % dataLen;
			        //console.log(app.currentIndex);
			        // 高亮当前图形
			        myChart.dispatchAction({
			          type: 'highlight',
			          seriesIndex: 0,
			          dataIndex: app.currentIndex,
			        });
			        // 显示 tooltip
			        myChart.dispatchAction({
			          type: 'showTip',
			          seriesIndex: 0,
			          dataIndex: app.currentIndex
			        });


			      }, 3000);
			      if (option && typeof option === "object") {
						myChart.setOption(option, true);
					}

					window.onresize = function(){
						myChart.resize();

					}
