openlayers6【十八】vue VectorLayer矢量图层实现批量图标点位上图功能详解
文章目录
- 1. 写在前面
- 2. openlayers实现批量标注点详解
- 3. 完整代码
1. 写在前面
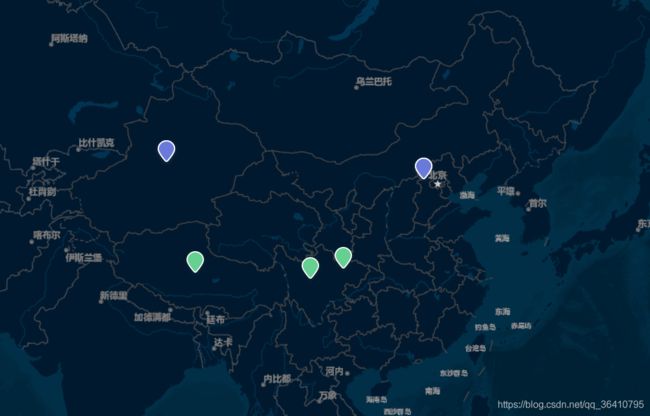
对于 VectorLayer矢量图层 的理解可以看下 openlayers 6【四】地图图层Layers详解 的内容,及上一篇的VectorLayer矢量图层的实际应用绘制区域的案例。下面将实现的是在地图上根据经纬度数据进行批量打点的需求。如下图所示效果。
2. openlayers实现批量标注点详解
2.1 addPoints() 方法详解:
- 实例化一个矢量图层
VectorLayer,命名为pointLayer - 把图层添加到map地图中,此时图层暂时没有数据
- 循环遍历
coordinates数组的坐标经纬度数据,每个循环的数据,创建一个点要素Feature,设置geometry的值为new Point(点)。可以通过setStyle设置点要素的样式效果,然后把每个要素 追加到已经声明的 this.featuresArr 中。 - 把 所有的要素信息即this.featuresArr 数据设置到
pointLayer图层的数据源中
2.1 addPoints() 方法完整代码:
/**
 * 批量根据经纬度坐标打点
 */
addPoints(coordinates) {
    // 设置图层
    this.pointLayer = new VectorLayer({
        source: new VectorSource()
    });
    // 添加图层
    this.map.addLayer(this.pointLayer);
    // 循环添加feature
    for (let i = 0; i < coordinates.length; i++) {
        // 创建feature,一个feature就是一个点坐标信息
        let feature = new Feature({
            geometry: new Point(
                fromLonLat([coordinates[i].x, coordinates[i].y])
            )
        });
        feature.setStyle(this.getIcon(coordinates[i].type));
        this.featuresArr.push(feature);
    } // for 结束
    // 批量添加feature
    this.pointLayer.getSource().addFeatures(this.featuresArr);
},
2.3 getIcon() 方法
- 根据传参类型判断 设置图标样式
getIcon(type) {
    let src = "";
    type == "bule"
        ? (src = require("../../assets/images/img-bule.png"))
        : (src = require("../../assets/images/img-lv.png"));
    var styleIcon = new Style({
        // 设置图片效果
        image: new Icon({
            src: src,
            anchor: [1, 1]
        })
    });
    return styleIcon;
},
3. 完整代码
<template>
    <div id="app">
        <div id="Map" ref="map">div>
    div>
template>
<script>
import "ol/ol.css";
import TileLayer from "ol/layer/Tile";
import VectorLayer from "ol/layer/Vector";
import VectorSource from "ol/source/Vector";
import XYZ from "ol/source/XYZ";
import { Map, View, Feature, ol } from "ol";
import { Style, Icon } from "ol/style";
import { Point } from "ol/geom";
import { defaults as defaultControls } from "ol/control";
import { fromLonLat } from "ol/proj";

// 边界json数据
export default {
    data() {
        return {
            map: null,
            pointLayer: null,
            featuresArr: []
        };
    },
    methods: {
        /**
         * 初始化地图
         */
        initMap() {
            this.map = new Map({
                target: "Map",
                controls: defaultControls({
                    zoom: true
                }).extend([]),
                layers: [
                    new TileLayer({
                        source: new XYZ({
                            url:
                                "http://map.geoq.cn/ArcGIS/rest/services/ChinaOnlineStreetPurplishBlue/MapServer/tile/{z}/{y}/{x}"
                        })
                    })
                ],
                view: new View({
                    center: fromLonLat([108.522097, 37.272848]),
                    zoom: 4.7,
                    maxZoom: 19,
                    minZoom: 4
                })
            });
        },

        /**
         * 批量根据经纬度坐标打点
         */
        addPoints(coordinates) {
            // 设置图层
            this.pointLayer = new VectorLayer({
                source: new VectorSource()
            });
            // 添加图层
            this.map.addLayer(this.pointLayer);
            // 循环添加feature
            for (let i = 0; i < coordinates.length; i++) {
                // 创建feature,一个feature就是一个点坐标信息
                let feature = new Feature({
                    geometry: new Point(
                        fromLonLat([coordinates[i].x, coordinates[i].y])
                    )
                });
                feature.setStyle(this.getIcon(coordinates[i].type));
                this.featuresArr.push(feature);
            } // for 结束
            // 批量添加feature
            this.pointLayer.getSource().addFeatures(this.featuresArr);
        },
        getIcon(type) {
            let src = "";
            type == "bule"
                ? (src = require("../../assets/images/img-bule.png"))
                : (src = require("../../assets/images/img-lv.png"));
            var styleIcon = new Style({
                // 设置图片效果
                image: new Icon({
                    src: src,
                    anchor: [1, 1]
                })
            });
            return styleIcon;
        }
    },
    mounted() {
        this.initMap();//初始化地图方法
        let coordinates = [
            { x: "106.918082", y: "31.441314", type: "lv" },
            { x: "86.36158200334317", y: "41.42448570787448", type: "bule" },
            { x: "89.71757707811526", y: "31.02619817424643", type: "lv" },
            { x: "116.31694544853109", y: "39.868508850821115", type: "bule" },
            { x: "103.07940932026341", y: "30.438580338450862", type: "lv" }
        ];
        this.addPoints(coordinates);//根据坐标点批量打点
    }
};
script>
<style lang="scss" scoped>
// 此处非核心内容,已删除
style>