Openlayers6 Examples学习笔记(2)
文章目录
- Tiled ArcGIS MapServer
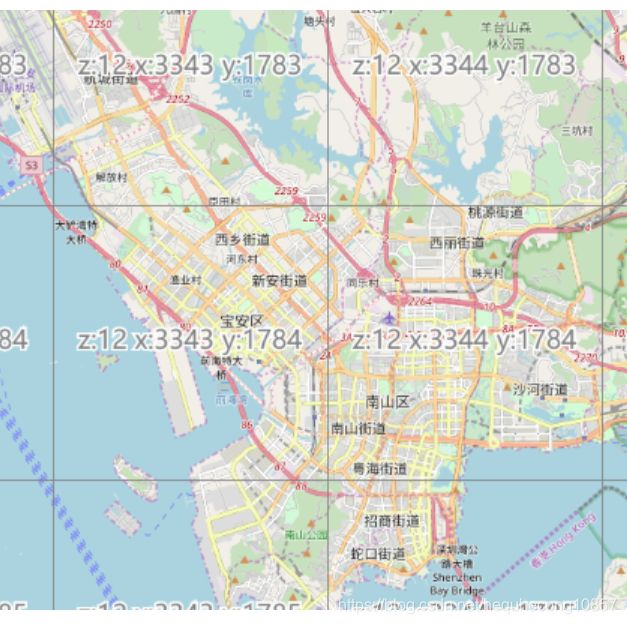
- Canvas Tiles(地图网格)
- Draw and Modify Features
- Dynamic Data
- Earthquakes with custom symbols
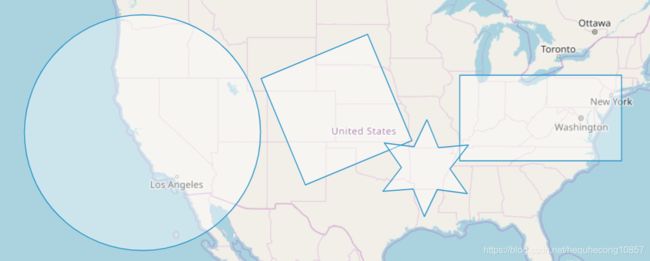
- Draw Shapes(绘制不同形状的几何图形)
Tiled ArcGIS MapServer
笔记:
加载ArcGIS Server发布的瓦片服务
import 'ol/ol.css';
import Map from 'ol/Map';
import View from 'ol/View';
import TileLayer from 'ol/layer/Tile';
import {OSM, TileArcGISRest} from 'ol/source';

var url = 'https://sampleserver1.arcgisonline.com/ArcGIS/rest/services/' +
    'Specialty/ESRI_StateCityHighway_USA/MapServer';

var layers = [
  new TileLayer({
    source: new OSM()
  }),
  new TileLayer({
    extent: [-13884991, 2870341, -7455066, 6338219],
    source: new TileArcGISRest({
      url: url
    })
  })
];
var map = new Map({
  layers: layers,
  target: 'map',
  view: new View({
    center: [-10997148, 4569099],
    zoom: 4
  })
});
Canvas Tiles(地图网格)
import 'ol/ol.css';
import Map from 'ol/Map';
import View from 'ol/View';
import TileLayer from 'ol/layer/Tile';
import {OSM, TileDebug} from 'ol/source';


var map = new Map({
  layers: [
    new TileLayer({
      source: new OSM()
    }),
    new TileLayer({
      source: new TileDebug()
    })
  ],
  target: 'map',
  view: new View({
    center: [0, 0],
    zoom: 1
  })
});
Draw and Modify Features
import 'ol/ol.css';
import Map from 'ol/Map';
import View from 'ol/View';
import {Draw, Modify, Snap} from 'ol/interaction';
import {Tile as TileLayer, Vector as VectorLayer} from 'ol/layer';
import {OSM, Vector as VectorSource} from 'ol/source';
import {Circle as CircleStyle, Fill, Stroke, Style} from 'ol/style';

var raster = new TileLayer({
  source: new OSM()
});

var source = new VectorSource();
var vector = new VectorLayer({
  source: source,
  style: new Style({
    fill: new Fill({
      color: 'rgba(255, 255, 255, 0.2)'
    }),
    stroke: new Stroke({
      color: '#ffcc33',
      width: 2
    }),
    image: new CircleStyle({
      radius: 7,
      fill: new Fill({
        color: '#ffcc33'
      })
    })
  })
});

var map = new Map({
  layers: [raster, vector],
  target: 'map',
  view: new View({
    center: [-11000000, 4600000],
    zoom: 4
  })
});

var modify = new Modify({source: source});
map.addInteraction(modify);

var draw, snap; // global so we can remove them later
var typeSelect = document.getElementById('type');

function addInteractions() {
  draw = new Draw({
    source: source,
    type: typeSelect.value
  });
  map.addInteraction(draw);
  // 开启捕捉模式
  snap = new Snap({source: source});
  map.addInteraction(snap);

}

/**
 * Handle change event.
 */
typeSelect.onchange = function() {
  map.removeInteraction(draw);
  map.removeInteraction(snap);
  addInteractions();
};

addInteractions();
Dynamic Data
import 'ol/ol.css';
import Map from 'ol/Map';
import View from 'ol/View';
import {MultiPoint, Point} from 'ol/geom';
import TileLayer from 'ol/layer/Tile';
import OSM from 'ol/source/OSM';
import {Circle as CircleStyle, Fill, Stroke, Style} from 'ol/style';
import {getVectorContext} from 'ol/render';

var tileLayer = new TileLayer({
  source: new OSM()
});

var map = new Map({
  layers: [tileLayer],
  target: 'map',
  view: new View({
    center: [0, 0],
    zoom: 2
  })
});

var imageStyle = new Style({
  image: new CircleStyle({
    radius: 5,
    fill: new Fill({color: 'yellow'}),
    stroke: new Stroke({color: 'red', width: 1})
  })
});

var headInnerImageStyle = new Style({
  image: new CircleStyle({
    radius: 2,
    fill: new Fill({color: 'blue'})
  })
});

var headOuterImageStyle = new Style({
  image: new CircleStyle({
    radius: 5,
    fill: new Fill({color: 'black'})
  })
});

var n = 200;
var omegaTheta = 30000; // Rotation period in ms
var R = 7e6;
var r = 2e6;
var p = 2e6;
tileLayer.on('postrender', function(event) {
  var vectorContext = getVectorContext(event);
  var frameState = event.frameState;
  var theta = 2 * Math.PI * frameState.time / omegaTheta;
  var coordinates = [];
  var i;
  for (i = 0; i < n; ++i) {
    var t = theta + 2 * Math.PI * i / n;
    var x = (R + r) * Math.cos(t) + p * Math.cos((R + r) * t / r);
    var y = (R + r) * Math.sin(t) + p * Math.sin((R + r) * t / r);
    coordinates.push([x, y]);
  }
  vectorContext.setStyle(imageStyle);
  vectorContext.drawGeometry(new MultiPoint(coordinates));

  // headPoint的坐标一直在变化,从而展示出数据的动态变化
  var headPoint = new Point(coordinates[coordinates.length - 1]);
  // console.log(headPoint);

  vectorContext.setStyle(headOuterImageStyle);
  vectorContext.drawGeometry(headPoint);

  vectorContext.setStyle(headInnerImageStyle);
  vectorContext.drawGeometry(headPoint);

  map.render();
});
map.render();
Earthquakes with custom symbols
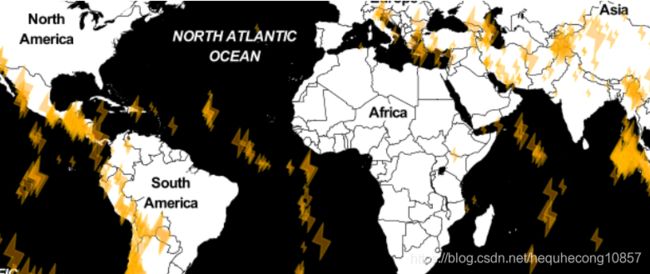
- 本地数据的加载
- 样式函数
- feature的属性信息获取
- 自定义符号的路径,通过canvas绘制
import 'ol/ol.css';
import Map from 'ol/Map';
import View from 'ol/View';
import KML from 'ol/format/KML';
import Polygon from 'ol/geom/Polygon';
import {Tile as TileLayer, Vector as VectorLayer} from 'ol/layer';
import {toContext} from 'ol/render';
import Stamen from 'ol/source/Stamen';
import VectorSource from 'ol/source/Vector';
import {Fill, Icon, Stroke, Style} from 'ol/style';

// 符号的绘制路径坐标
var symbol = [[0, 0], [4, 2], [6, 0], [10, 5], [6, 3], [4, 5], [0, 0]];
var scale;
var scaleFunction = function(coordinate) {
  return [coordinate[0] * scale, coordinate[1] * scale];
};

var styleCache = {};
var styleFunction = function(feature) {
  // 2012_Earthquakes_Mag5.kml stores the magnitude of each earthquake in a
  // standards-violating  tag in each Placemark.  We extract it from
  // the Placemark's name instead.
  // 读取name属性
  var name = feature.get('name');
  // 读取震级
  var magnitude = parseFloat(name.substr(2));
  // 根据震级设置符号大小
  var size = parseInt(10 + 40 * (magnitude - 5), 10);
  // 设置缩放比例
  scale = size / 10;
  var style = styleCache[size];
  if (!style) {
    var canvas = document.createElement('canvas');
    // 获取canvas画布
    var vectorContext = toContext(canvas.getContext('2d'),
      {size: [size, size], pixelRatio: 1});
    vectorContext.setStyle(new Style({
      fill: new Fill({color: 'rgba(255, 153, 0, 0.4)'}),
      stroke: new Stroke({color: 'rgba(255, 204, 0, 0.2)', width: 2})
    }));
    vectorContext.drawGeometry(new Polygon([symbol.map(scaleFunction)]));
    style = new Style({
      image: new Icon({
        img: canvas,
        imgSize: [size, size],
        rotation: 1.2
      })
    });
    styleCache[size] = style;
  }
  return style;
};

var vector = new VectorLayer({
  source: new VectorSource({
    // url需要加上require才能加载本地的kml文件
    url: require('./data/kml/2012_Earthquakes_Mag5.kml'),
    format: new KML({
      extractStyles: false
    })
  }),
  style: styleFunction
});

var raster = new TileLayer({
  source: new Stamen({
    layer: 'toner'
  })
});

var map = new Map({
  layers: [raster, vector],
  target: 'map',
  view: new View({
    center: [0, 0],
    zoom: 2
  })
});
Draw Shapes(绘制不同形状的几何图形)
import 'ol/ol.css';
import Map from 'ol/Map';
import View from 'ol/View';
import Polygon from 'ol/geom/Polygon';
import Draw, {createRegularPolygon, createBox} from 'ol/interaction/Draw';
import {Tile as TileLayer, Vector as VectorLayer} from 'ol/layer';
import {OSM, Vector as VectorSource} from 'ol/source';

var raster = new TileLayer({
  source: new OSM()
});

var source = new VectorSource({wrapX: false});

var vector = new VectorLayer({
  source: source
});

var map = new Map({
  layers: [raster, vector],
  target: 'map',
  view: new View({
    center: [-11000000, 4600000],
    zoom: 4
  })
});

var typeSelect = document.getElementById('type');

var draw; // global so we can remove it later
function addInteraction() {
  var value = typeSelect.value;
  if (value !== 'None') {
    var geometryFunction;
    if (value === 'Square') {
      value = 'Circle';
      geometryFunction = createRegularPolygon(4);
    } else if (value === 'Box') {
      value = 'Circle';
      geometryFunction = createBox();
    } else if (value === 'Star') {
      value = 'Circle';
      geometryFunction = function(coordinates, geometry) {
        var center = coordinates[0];
        var last = coordinates[1];
        var dx = center[0] - last[0];
        var dy = center[1] - last[1];
        var radius = Math.sqrt(dx * dx + dy * dy);
        var rotation = Math.atan2(dy, dx);
        var newCoordinates = [];
        var numPoints = 12;
        for (var i = 0; i < numPoints; ++i) {
          var angle = rotation + i * 2 * Math.PI / numPoints;
          var fraction = i % 2 === 0 ? 1 : 0.5;
          var offsetX = radius * fraction * Math.cos(angle);
          var offsetY = radius * fraction * Math.sin(angle);
          newCoordinates.push([center[0] + offsetX, center[1] + offsetY]);
        }
        newCoordinates.push(newCoordinates[0].slice());
        if (!geometry) {
          geometry = new Polygon([newCoordinates]);
        } else {
          geometry.setCoordinates([newCoordinates]);
        }
        return geometry;
      };
    }
    draw = new Draw({
      source: source,
      type: value,
      geometryFunction: geometryFunction
    });
    map.addInteraction(draw);
  }
}


/**
 * Handle change event.
 */
typeSelect.onchange = function() {
  map.removeInteraction(draw);
  addInteraction();
};

addInteraction();


