台大李宏毅机器学习作业4(HW4)——可解释机器学习
最近刚开始学习机器学习,看的是台湾大学李宏毅老师的视频课程Machine Learning 2019,李宏毅老师课程共有8个作业,在网上大约可以搜到前三个作业的解答,分别是PM2.5预测,人薪酬的二分类和表情分类,我在做这三次作业中主要参考了秋沐霖的三篇博客,链接如下:
作业1:线性回归预测PM2.5----台大李宏毅机器学习作业1(HW1)
作业2:Logistic回归预测收入----台大李宏毅机器学习作业2(HW2)
作业3:基于卷积神经网络的面部表情识别(Pytorch实现)----台大李宏毅机器学习作业3(HW3)
说回作业4,作业4的主题是可解释机器学习,作业4的ppt提出了以下任务:
Task1 - Saliency Map
这一部分就是求输出对输入图像的梯度,输入图像中梯度比较大的部分就是对输出有较大影响的部分。

Task2 - Filter Visualization
这一部分是滤波器的可视化,即卷积神经网络中的卷积核的可视化,上课提到的方式是用梯度上升的方法改变输入图像,使某个滤波器被激活的程度达到最大,并将此时的输入图像显示出来,此时显示的图像就是这个滤波器检测的pattern。通常浅层滤波器用于检测最基础的元素比如色彩或者灰度,深层次的滤波器用来探测线条、纹路等更加复杂的特征。
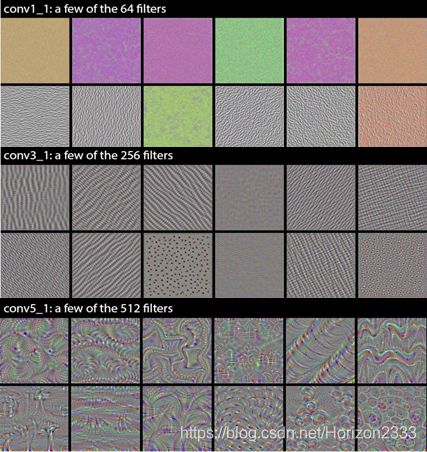
Task-3 Lime
这个任务就是使用Local Interpretable Model-Agnostic Explanations的方法来进行可解释机器学习,这个方法首先将输入划分为不同的segment,之后将一部分segment去掉观察结果的变化,从而区分出图像中对分类把握贡献为正的segment和为负的segment。在python有lime这个包可以直接调用。

这个部分首先需要train一个表情识别的model,我继续使用了从秋沐霖大佬作业3中复制的代码训练出来的model,不过要对代码进行一定程度的修改,首先添加了保存test acc最高的模型的代码,其次添加了GPU训练的一些代码来利用手里的GPU加速训练,还对模型添加了一些修改从而可以访问每一层的输出,这是为了方便后面的卷积核可视化。我修改后的代码如下,如果有不妥的地方可以参考秋沐霖大佬的博客来进行修改。并且代码中使用的csv文件也可以从那里下载。
import torch
import torch.utils.data as data
import torch.nn as nn
import torch.optim as optim
import numpy as np
import pandas as pd
import cv2
import time

#device = torch.device("cuda:0" if torch.cuda.is_available() else "cpu")

# 参数初始化
def gaussian_weights_init(m):
    classname = m.__class__.__name__
    # 字符串查找find,找不到返回-1,不等-1即字符串中含有该字符
    if classname.find('Conv') != -1:
        m.weight.data.normal_(0.0, 0.04)

# 验证模型在验证集上的正确率
def validate(model, dataset, batch_size):
    val_loader = data.DataLoader(dataset, batch_size)
    result, num = 0.0, 0
    for images, labels in val_loader:
        images = images.cuda()
        labels = labels.cuda()
        pred = model.forward(images)
        pred = np.argmax(pred.data.cpu().numpy(), axis=1)
        labels = labels.data.cpu().numpy()
        result += np.sum((pred == labels))
        num += len(images.cpu())
    acc = result / num
    return acc

class FaceDataset(data.Dataset):
    # 初始化
    def __init__(self, root):
        super(FaceDataset, self).__init__()
        self.root = root
        df_path = pd.read_csv(root + '\\dataset.csv', header=None, usecols=[0])
        df_label = pd.read_csv(root + '\\dataset.csv', header=None, usecols=[1])
        self.path = np.array(df_path)[:, 0]
        self.label = np.array(df_label)[:, 0]

    # 读取某幅图片,item为索引号
    def __getitem__(self, item):
        # 图像数据用于训练,需为tensor类型,label用numpy或list均可
        face = cv2.imread(self.root + '\\' + self.path[item])
        # 读取单通道灰度图
        face_gray = cv2.cvtColor(face, cv2.COLOR_BGR2GRAY)
        # 高斯模糊
        # face_Gus = cv2.GaussianBlur(face_gray, (3,3), 0)
        # 直方图均衡化
        face_hist = cv2.equalizeHist(face_gray)
        # 像素值标准化
        face_normalized = face_hist.reshape(1, 48, 48) / 255.0
        face_tensor = torch.from_numpy(face_normalized)
        face_tensor = face_tensor.type('torch.FloatTensor')
        label = self.label[item]
        return face_tensor, label

    # 获取数据集样本个数
    def __len__(self):
        return self.path.shape[0]

class FaceCNN(nn.Module):
    # 初始化网络结构
    def __init__(self):
        super(FaceCNN, self).__init__()

        # 第一次卷积、池化
        self.conv1 = nn.Sequential(
            # 输入通道数in_channels,输出通道数(即卷积核的通道数)out_channels,卷积核大小kernel_size,步长stride,对称填0行列数padding
            # input:(bitch_size, 1, 48, 48), output:(bitch_size, 64, 48, 48), (48-3+2*1)/1+1 = 48
            nn.Conv2d(in_channels=1, out_channels=64, kernel_size=3, stride=1, padding=1), # 卷积层
            nn.BatchNorm2d(num_features=64), # 归一化
            nn.RReLU(inplace=True), # 激活函数
            # output(bitch_size, 64, 24, 24)
            nn.MaxPool2d(kernel_size=2, stride=2), # 最大值池化
        )

        # 第二次卷积、池化
        self.conv2 = nn.Sequential(
            # input:(bitch_size, 64, 24, 24), output:(bitch_size, 128, 24, 24), (24-3+2*1)/1+1 = 24
            nn.Conv2d(in_channels=64, out_channels=128, kernel_size=3, stride=1, padding=1),
            nn.BatchNorm2d(num_features=128),
            nn.RReLU(inplace=True),
            # output:(bitch_size, 128, 12 ,12)
            nn.MaxPool2d(kernel_size=2, stride=2),
        )

        # 第三次卷积、池化
        self.conv3 = nn.Sequential(
            # input:(bitch_size, 128, 12, 12), output:(bitch_size, 256, 12, 12), (12-3+2*1)/1+1 = 12
            nn.Conv2d(in_channels=128, out_channels=256, kernel_size=3, stride=1, padding=1),
            nn.BatchNorm2d(num_features=256),
            nn.RReLU(inplace=True),
            # output:(bitch_size, 256, 6 ,6)
            nn.MaxPool2d(kernel_size=2, stride=2),
        )

        # 参数初始化
        self.conv1.apply(gaussian_weights_init)
        self.conv2.apply(gaussian_weights_init)
        self.conv3.apply(gaussian_weights_init)

        # 全连接层
        self.fc = nn.Sequential(
            nn.Dropout(p=0.2),
            nn.Linear(in_features=256*6*6, out_features=4096),
            nn.RReLU(inplace=True),
            nn.Dropout(p=0.5),
            nn.Linear(in_features=4096, out_features=1024),
            nn.RReLU(inplace=True),
            nn.Linear(in_features=1024, out_features=256),
            nn.RReLU(inplace=True),
            nn.Linear(in_features=256, out_features=7),
        )
        self.features = nn.Sequential(*list(self.children())[:4])

    # 前向传播
    def forward(self, x):
        x = self.conv1(x)
        x = self.conv2(x)
        x = self.conv3(x)
        # 数据扁平化
        x = x.view(x.shape[0], -1)
        y = self.fc(x)
        return y

def train(train_dataset, val_dataset, batch_size, epochs, learning_rate, wt_decay):
    # 载入数据并分割batch
    train_loader = data.DataLoader(train_dataset, batch_size)
    # 构建模型
    model = FaceCNN()
    model = model.cuda()
    # 损失函数
    loss_function = nn.CrossEntropyLoss()
    loss_function = loss_function.cuda()
    # 优化器
    optimizer = optim.SGD(model.parameters(), lr=learning_rate, weight_decay=wt_decay)
    # 学习率衰减
    # scheduler = optim.lr_scheduler.StepLR(optimizer, step_size=10, gamma=0.8)
    # 逐轮训练
    print('Start to train!')
    starttime = time.time()
    best_acc = 0
    for epoch in range(epochs):
        # 记录损失值
        loss_rate = 0
        # scheduler.step() # 学习率衰减
        model.train() # 模型训练
        for images, labels in train_loader:
            images = images.cuda()
            labels = labels.cuda()
            # 梯度清零
            optimizer.zero_grad()
            # 前向传播
            output = model.forward(images)
            # 误差计算
            loss_rate = loss_function(output, labels)
            # 误差的反向传播
            loss_rate.backward()
            # 更新参数
            optimizer.step()

        # 打印每轮的损失
        #print('After {} epochs , the loss_rate is : '.format(epoch+1), loss_rate.item())
        model.eval() # 模型评估
        acc_train = validate(model, train_dataset, batch_size)
        acc_val = validate(model, val_dataset, batch_size)
        print('After {} epochs , the acc_train is : '.format(epoch), acc_train)
        print('After {} epochs , the acc_val is : '.format(epoch), acc_val)
        if(acc_val > best_acc):
            torch.save(model.state_dict(), 'model.pth')
            best_acc = acc_val
            print ('Model Saved!')


    model.eval() # 模型评估
    acc_train = validate(model, train_dataset, batch_size)
    acc_val = validate(model, val_dataset, batch_size)
    print('After {} epochs , the acc_train is : '.format(epoch+1), acc_train)
    print('After {} epochs , the acc_val is : '.format(epoch+1), acc_val)
    endtime = time.time()
    print('time cost:', int((endtime - starttime) / 60), 'min', int((endtime - starttime) % 60), 's')
    return model

def main():
    # 数据集实例化(创建数据集)
    train_dataset = FaceDataset(root='face\\train')
    val_dataset = FaceDataset(root='face\\val')
    print('Data set over!')
    # 超参数可自行指定
    model = train(train_dataset, val_dataset, batch_size=32, epochs=100, learning_rate=0.1, wt_decay=0)
    # 保存模型
    torch.save(model, 'model_net1.pkl')


if __name__ == '__main__':
    main()
还没想好我的模型怎么上传,如果大家需要我就上传一波,不过准确率才刚刚60%的样子,决定暂时还是先不献丑了。
有了训练好的model就可以来着手解决这个作业了。
首先,Saliency Map可以通过输出对输入求微分得到,使用pytorch的自动求导机制可以很方便地实现这一点。
def compute_saliency_maps(x, y, model):
    model.eval()
    x.requires_grad_()
    y_pred = model(x.cuda())
    loss_func = torch.nn.CrossEntropyLoss()
    loss = loss_func(y_pred, y.cuda().long())
    loss.backward()

    saliency = x.grad.abs().squeeze().data
    print(saliency.size())
    return saliency
上面这部分代码就可以使用backward函数来计算对输入的梯度,取其绝对值作为返回值返回。之后进行可视化:
def show_saliency_maps(x, y, model):
    x_org = x.squeeze()
    x = torch.tensor(x)
    y = torch.tensor(y)
    # Compute saliency maps for images in X
    saliency = compute_saliency_maps(x, y, model)
    print(saliency[0,0,0])
    # Convert the saliency map from Torch Tensor to numpy array and show images
    # and saliency maps together.
    saliency = saliency.detach().cpu()

    num_pics = x_org.shape[0]
    for i in range(num_pics):
        # You need to save as the correct fig names
        plt.imsave('saliency\\pic_'+ str(i) + '.jpg', x_org[i], cmap=plt.cm.gray)
        plt.imsave('saliency\\saliency_'+ str(i) + '.jpg', saliency[i], cmap=plt.cm.jet)
        if(i == 7):
            plt.figure()
            plt.subplot(1,3,1)
            plt.imshow(x_org[i], cmap='gray')
            plt.subplot(1,3,2)
            plt.imshow(saliency[i], cmap='gray')
            #plt.colorbar()
            plt.subplot(1,3,3)
            subx = x_org[i]
            for j in range(saliency[i].size()[0]):
                for k in range(saliency[i].size()[1]):
                    if(saliency[i,j,k]*1000000 < 0.04):
                        subx[j,k] = 0
            plt.imshow(subx, cmap='gray')
上述代码将saliency map分别计算出来并保存到文件夹saliency里面,并且用matplotlab画出了第七张人脸的saliency map(因为这个看起来效果还算不错)。结果如下:

emmm跟想象中好像不太一样,不过我这模型也比较弱,好歹可以看出来人脸上的点是比较多的,证明人脸对结果的影响要比头发或者背景大。可以修改上面代码的i=7从而可视化其他人脸,不过一部分也保存在saliency文件夹下面了,如果找不到在代码旁边新建一个叫这个的文件夹,再运行一遍应该就没有问题了。不过要修改上面saliency[i,j,k]*1000000 < 0.04的参数,否则可能第三张图什么都没有或者什么都没过滤掉,我发现不同的人脸求出来的saliency在数量级上差距还是比较大的。
在做第二个任务之前,既然要可视化卷积核,首先要能得到卷积核的输出,这里我忘记了在哪里copy的下面的代码了。
class LayerActivations:
    features = None

    def __init__(self, model, layer_num):
        self.hook = model[layer_num].register_forward_hook(self.hook_fn)

    def hook_fn(self, module, input, output):
        self.features = output.cpu()

    def remove(self):
        self.hook.remove()
这一部分即可提取每一层的输出,如果不改秋沐霖大佬的代码是没法执行这个的,因为模型没办法索引,我主要是在模型定义的__init__函数最后添加了下面一句。
self.features = nn.Sequential(*list(self.children())[:4])
之后写了一堆画图代码来进行可视化。
	conv_out = LayerActivations(model.features[0], 0)  # 提出第 一个卷积层的输出
    o = model(Variable(torch.tensor(x_train[0]).view(1,1,48,48).cuda()))
    conv_out.remove()  #
    act = conv_out.features  # act 即 第0层输出的特征
    # 可视化 输出
    fig1 = plt.figure(1,figsize=(20, 50))
    fig1.suptitle('Convolution layer 1 output')

    for i in range(act.size()[1]):
        ax = fig1.add_subplot(8, 8, i+1, xticks=[], yticks=[])
        ax.imshow(act[0][i].detach().numpy(), cmap="gray")

    conv_out = LayerActivations(model.features[1], 0)
    o = model(Variable(torch.tensor(x_train[0]).view(1,1,48,48).cuda()))
    conv_out.remove()  #
    act = conv_out.features  # act 即 第0层输出的特征
    # 可视化 输出
    fig3 = plt.figure(3,figsize=(20, 50))
    fig3.suptitle('Convolution layer 2 output')

    for i in range(act.size()[1]):
        ax = fig3.add_subplot(8, 16, i+1, xticks=[], yticks=[])
        ax.imshow(act[0][i].detach().numpy(), cmap="gray")

    conv_out = LayerActivations(model.features[2], 0)  # 提出第 一个卷积层的输出
    o = model(Variable(torch.tensor(x_train[0]).view(1,1,48,48).cuda()))
    conv_out.remove()  #
    act = conv_out.features  # act 即 第0层输出的特征
    # 可视化 输出
    fig5 = plt.figure(5,figsize=(20, 50))
    fig5.suptitle('Convolution layer 3 output')

    for i in range(act.size()[1]):
        ax = fig5.add_subplot(16, 16, i+1, xticks=[], yticks=[])
        ax.imshow(act[0][i].detach().numpy(), cmap="gray")
由于这里有3层卷积层,分别有64,128,256个卷积核,所以我就把他们的输出都显示出来了。
第一层卷积层输出

第二层卷积层输出
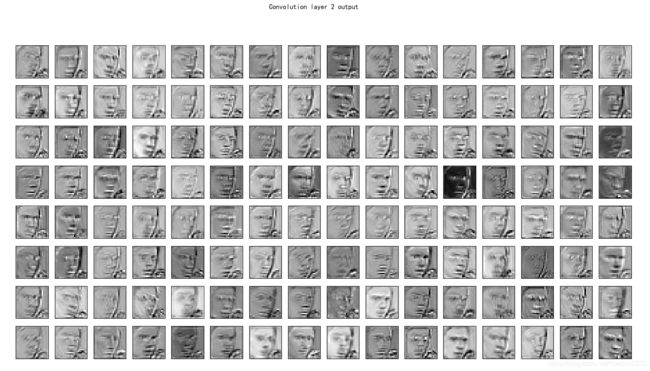
第三层卷积层输出
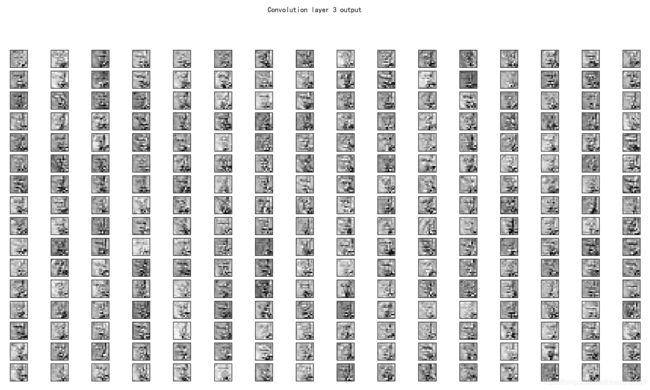
其实没太看懂做了什么,不过大概都是对这个输入图像的处理。
下面就可以进行task2来可视化卷积核了,首先要计算某个卷积核对输入的梯度,代码如下
def compute_gradients(x, model, filter_model, filter_id):
    gradient = torch.zeros(x.shape)
    model.eval()
    conv_out = LayerActivations(filter_model, 0)  # 提出第 一个卷积层的输出
    o = model(x)
    conv_out.remove()  #
    act = conv_out.features  # act 即 第0层输出的特征

    activation = torch.sum(act[:,filter_id,:,:])
    activation.backward()

    gradient = x.grad.data
    return gradient
这里注释有点不太对,忽略它,输入参数model是整个model,fiter_model是某一层卷积层,filter_id是这个卷积层里第几个卷积核,对这个卷积核的响应求和再反向传播,就可以求出它对输入的梯度。
梯度上升的代码如下:
def visualize_filter(x, model, filter_model, filter_number, epochs, learning_rate):
    images = []
    for k in range(filter_number):
        for i in range(epochs):
            gradients = compute_gradients(x,model,filter_model,k)
            #self.gradients /= (torch.sqrt(torch.mean(torch.mul(self.gradients, self.gradients))) + 1e-5)
            x = x.cpu() + gradients.cpu() * learning_rate
            x = Variable(x.cuda(), requires_grad = True)
        images.append(x.cpu().detach().numpy().squeeze())
        print('Filter '+str(k+1)+' visualize over!')
    return images
这个就是最简单的梯度上升,learning rate由参数确定,循环epochs次之后得到结果返回。
将所有滤波器可视化的代码如下(又是一堆画图代码)
	#initialize input x
    x = []
    for i in range(48):
        x_temp = []
        for j in range(48):
            x_temp.append(random.gauss(0,0.5))
        x.append(x_temp)
    x = np.array(x).reshape(1,1,48,48)
    x = Variable(torch.tensor(x).float().cuda(), requires_grad = True)

    newx = visualize_filter(x,model,model.features[0], 64, 100, 0.1)

    fig2 = plt.figure(2,figsize=(20, 50))
    for i in range(64):
        ax = fig2.add_subplot(8, 8, i+1, xticks=[], yticks=[])
        ax.imshow(newx[i], cmap="gray")
    fig2.suptitle('Convolution layer 1 maximizition')

    newx = visualize_filter(x,model,model.features[1], 128, 100, 0.1)

    fig4 = plt.figure(4,figsize=(20, 50))
    for i in range(128):
        ax = fig4.add_subplot(8, 16, i+1, xticks=[], yticks=[])
        ax.imshow(newx[i], cmap="gray")
    fig4.suptitle('Convolution layer 2 maximizition')

    newx = visualize_filter(x,model,model.features[2], 256, 100, 0.1)

    fig6 = plt.figure(6,figsize=(20, 50))
    for i in range(256):
        ax = fig6.add_subplot(16, 16, i+1, xticks=[], yticks=[])
        ax.imshow(newx[i], cmap="gray")
    fig6.suptitle('Convolution layer 3 maximizition')
这一部分代码运行还挺慢的,要稍微等一会,得到的结果如下:
第一层卷积层可视化:

第二层卷积层可视化:
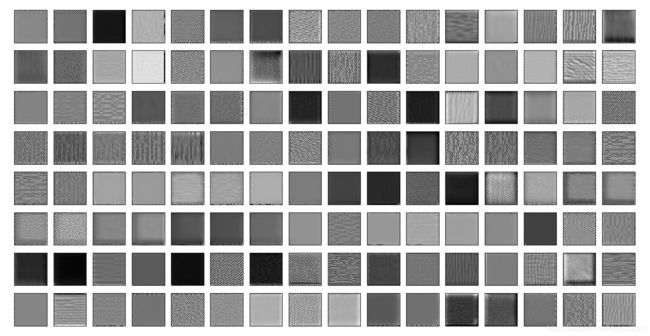
第三层卷积层可视化:
从结果来看,很显然第一层卷积层检测的东西是灰度,不同卷积核检测不同的灰度;从第二层的卷积核可视化结果来看,有横的竖的斜的条纹,这个应该是用来检测这样复杂一点的特征的,至于第三个就看不太懂了,应该是更高级的pattern。
不过我觉得这样有点奇怪,从第二层卷积层开始就是将上一层卷积层的输出作为输入,这相当于固定了前面卷积层的参数,从而可视化的卷积核是不是它与前面的卷积核组合的结果,感觉应该把这层卷积层单独提取出来做梯度上升,不过我暂时还不会改也就算了。
既然都是做梯度上升,我想到同样可以用这个办法来可视化使某个类别输出最大的输入图像,就是让机器告诉我们什么样的人脸是最符合他对这种类别的认识的。类似地梯度上升的代码
def visualize_class(x, model, epochs, learning_rate):
    images = []
    for k in range(7):
        for i in range(epochs):
            gradients = torch.zeros(x.shape)
            model.eval()
            output = model(x)
            activation = output[0,k]
            activation.backward()

            gradients = x.grad.data
            x = x.cpu() + gradients.cpu() * learning_rate
            x = Variable(x.cuda(), requires_grad = True)
        images.append(x.cpu().detach().numpy().squeeze())
        print('Class '+str(k+1)+' visualize over!')
    return images
又是一堆画图代码
    #initialize input x
    x = []
    for i in range(48):
        x_temp = []
        for j in range(48):
            x_temp.append(random.gauss(0,0.5))
        x.append(x_temp)
    x = np.array(x).reshape(1,1,48,48)
    x = Variable(torch.tensor(x).float().cuda(), requires_grad = True)

    newx = visualize_class(x,model, 100, 0.1)

    fig7 = plt.figure(2,figsize=(20, 50))
    for i in range(7):
        print(i,' : ',model(Variable(torch.tensor(newx[i]).view(1,1,48,48).cuda())))
        ax = fig7.add_subplot(1, 7, i+1, xticks=[], yticks=[])
        ax.set_title(class_judge(i))
        ax.imshow(newx[i], cmap="gray")
    fig7.suptitle('Class maximizition')
最终结果如下:

果然通常是没有好的结果的,要想机器认为最符合某种表情的输入与人的判断相同的话,要对这个过程添加正则化,不过我也不会。
task3 lime的话要安装lime这个package,lime的第一步是将图像划分为不同的segment,这里使用了skimage.segmentation来完成这个工作。
再lime之前首先要写两个函数作为lime某些函数的参数,分别是
def predict(input):
    return model(torch.tensor(input)[:,0:1,:,:,0].float().cuda()).cpu().detach().numpy()

def segmentation(input):
    #print(np.shape(input))
    return slic(input)
之后就是lime和画图的代码
    x_train_rgb = np.stack((x_train[0:10],)*3, axis=-1).squeeze()
    #x_train_rgb = Variable(torch.tensor(x_train_rgb).cuda())
    #print(x_train_rgb.size())
    # Initiate explainer instance
    print(np.shape(x_train_rgb))
    explainer = lime_image.LimeImageExplainer()

    # Get the explaination of an image
    explaination = explainer.explain_instance(
                                image=x_train_rgb[0:10],
                                classifier_fn=predict,
                                segmentation_fn=segmentation,
                            )

    # Get processed image
    image, mask = explaination.get_image_and_mask(
                                    label=explaination.top_labels[0],
                                    #torch.tensor(y_train[0:10]).long(),
                                    negative_only=False,
                                    positive_only=True,
                                    hide_rest=False,
                                    num_features=7,
                                    min_weight=0.0
                                )
    img_boundry1 = mark_boundaries(image, mask).squeeze()
    # save the image
    fig8 = plt.figure(8,figsize=(20, 50))
    for i in range(np.shape(img_boundry1)[0]):
        ax = fig8.add_subplot(2, 5, i+1, xticks=[], yticks=[])
        ax.imshow(img_boundry1[i])
    fig8.suptitle('Positive area')

    image, mask = explaination.get_image_and_mask(
                                    label=explaination.top_labels[0],
                                    #torch.tensor(y_train[0:10]).long(),
                                    negative_only=True,
                                    positive_only=False,
                                    hide_rest=False,
                                    num_features=7,
                                    min_weight=0.0
                                )
    img_boundry2 = mark_boundaries(image, mask).squeeze()
    # save the image
    fig9 = plt.figure(9,figsize=(20, 50))
    for i in range(np.shape(img_boundry2)[0]):
        ax = fig9.add_subplot(2, 5, i+1, xticks=[], yticks=[])
        ax.imshow(img_boundry2[i])
    fig9.suptitle('Negative area')

    image, mask = explaination.get_image_and_mask(
                                    label=explaination.top_labels[0],
                                    #torch.tensor(y_train[0:10]).long(),
                                    negative_only=False,
                                    positive_only=False,
                                    hide_rest=False,
                                    num_features=7,
                                    min_weight=0.0
                                )
    img_boundry3 = mark_boundaries(image, mask).squeeze()
    # save the image
    fig10 = plt.figure(10,figsize=(20, 50))
    for i in range(np.shape(img_boundry3)[0]):
        ax = fig10.add_subplot(2, 5, i+1, xticks=[], yticks=[])
        ax.imshow(img_boundry3[i])
    fig10.suptitle('Green:Positive area,Red:Negative area,Yellow:boundary')
lime的用法我也不是太懂,不过通过查资料什么的还是让它跑起来了,因为不太懂,我也就不胡乱解释这些参数了。直接上结果:
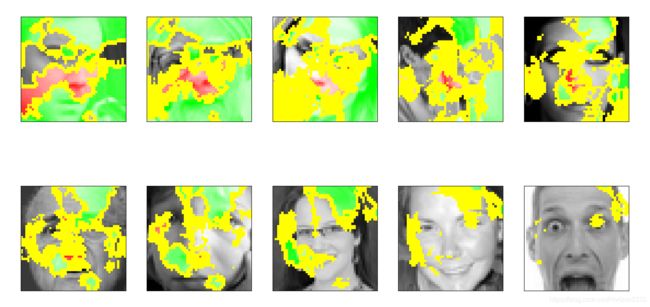
图中绿色是对结果影响为正的区域,红色是对结果影响为负的区域,居然有好多区域集中在人脸外边,看来训练的模型跑偏了。
上面就是我完成这个作业的全部过程了,其实是代码东拼西凑加调bug的过程,写在这里供大家借鉴一下子。完整代码会贴在最后,注意其中的参数
#control display image
saliency_map = 0
filter_output = 0
filter_visualization = 0
class_visualization = 0
lime = 0
model_path = 'E:\\李宏毅机器学习\\ML_code\\3expression_recognition\\3expression_recognition\\model.pth'
完成了上面5个步骤,令上面某个参数为1即可运行该步骤的代码,因为画图实在是太多了,一下子都显示出来很头疼,所以分成5部分,不把某些改成1的话就不会运行,相当于就只加载了数据和模型。记得还要修改model_path为模型所在的路径,否则模型就加载不出来。
这算是我第一次写机器学习方面的博客,我是一个机器学习的初学者,中间肯定有很多错误,博客写的也很烂,希望能给大家提供帮助,毕竟找李宏毅老师ppt和作业链接弄了好久,代码也写了好久。如有不妥欢迎指正讨论,谢谢大家。另外写这一篇也不容易,转载请注明出处。
最后单独感谢一下秋沐霖大佬写了前三次作业的博客,否则我这一部分也无从谈起,而且博客写的水平也比我高很多,并且找他借鉴代码也同意了,万分感谢!

最后全部代码如下:
# -*- coding: utf-8 -*-

import random
import cv2
import numpy as np
import torch
import torch.nn as nn
from torch.autograd import Variable
import matplotlib.pyplot as plt
from lime import lime_image
from skimage.segmentation import slic,mark_boundaries

# 参数初始化
def gaussian_weights_init(m):
    classname = m.__class__.__name__
    # 字符串查找find,找不到返回-1,不等-1即字符串中含有该字符
    if classname.find('Conv') != -1:
        m.weight.data.normal_(0.0, 0.04)

def load_data():
    # 从csv中读取有用的信息
    x = np.loadtxt('data.csv')
    x = x.reshape(np.shape(x)[0], 48, 48)
    y = np.loadtxt('label.csv')

    print(np.shape(x),np.shape(y))
    # 划分训练集与验证集
    x_train, x_test = x[0:24000, :, :], x[24000:-1, :, :]
    y_train, y_test = y[0:24000], y[24000:-1]

    x_train=x_train.reshape(x_train.shape[0],1,48,48)
    x_test=x_test.reshape(x_test.shape[0],1,48,48)
    x_train=x_train.astype('float32')
    x_test=x_test.astype('float32')
    #one-hot encoding
    #y_train=np_utils.to_categorical(y_train,7)
    #y_test=np_utils.to_categorical(y_test,7)
    x_train=x_train/255
    x_test=x_test/255
    #x_test=np.random.normal(x_test)
    return (x_train,y_train),(x_test,y_test)

class FaceCNN(nn.Module):
    # 初始化网络结构
    def __init__(self):
        super(FaceCNN, self).__init__()

        # 第一次卷积、池化
        self.conv1 = nn.Sequential(
            # 输入通道数in_channels,输出通道数(即卷积核的通道数)out_channels,卷积核大小kernel_size,步长stride,对称填0行列数padding
            # input:(bitch_size, 1, 48, 48), output:(bitch_size, 64, 48, 48), (48-3+2*1)/1+1 = 48
            nn.Conv2d(in_channels=1, out_channels=64, kernel_size=3, stride=1, padding=1), # 卷积层
            nn.BatchNorm2d(num_features=64), # 归一化
            nn.RReLU(inplace=True), # 激活函数
            # output(bitch_size, 64, 24, 24)
            nn.MaxPool2d(kernel_size=2, stride=2), # 最大值池化
        )

        # 第二次卷积、池化
        self.conv2 = nn.Sequential(
            # input:(bitch_size, 64, 24, 24), output:(bitch_size, 128, 24, 24), (24-3+2*1)/1+1 = 24
            nn.Conv2d(in_channels=64, out_channels=128, kernel_size=3, stride=1, padding=1),
            nn.BatchNorm2d(num_features=128),
            nn.RReLU(inplace=True),
            # output:(bitch_size, 128, 12 ,12)
            nn.MaxPool2d(kernel_size=2, stride=2),
        )

        # 第三次卷积、池化
        self.conv3 = nn.Sequential(
            # input:(bitch_size, 128, 12, 12), output:(bitch_size, 256, 12, 12), (12-3+2*1)/1+1 = 12
            nn.Conv2d(in_channels=128, out_channels=256, kernel_size=3, stride=1, padding=1),
            nn.BatchNorm2d(num_features=256),
            nn.RReLU(inplace=True),
            # output:(bitch_size, 256, 6 ,6)
            nn.MaxPool2d(kernel_size=2, stride=2),
        )

        # 参数初始化
        self.conv1.apply(gaussian_weights_init)
        self.conv2.apply(gaussian_weights_init)
        self.conv3.apply(gaussian_weights_init)

        # 全连接层
        self.fc = nn.Sequential(
            nn.Dropout(p=0.2),
            nn.Linear(in_features=256*6*6, out_features=4096),
            nn.RReLU(inplace=True),
            nn.Dropout(p=0.5),
            nn.Linear(in_features=4096, out_features=1024),
            nn.RReLU(inplace=True),
            nn.Linear(in_features=1024, out_features=256),
            nn.RReLU(inplace=True),
            nn.Linear(in_features=256, out_features=7),
        )
        self.features = nn.Sequential(*list(self.children())[:4])

    # 前向传播
    def forward(self, x):
        x = self.conv1(x)
        x = self.conv2(x)
        x = self.conv3(x)
        # 数据扁平化
        x = x.view(x.shape[0], -1)
        y = self.fc(x)
        return y

def compute_saliency_maps(x, y, model):
    model.eval()
    x.requires_grad_()
    y_pred = model(x.cuda())
    loss_func = torch.nn.CrossEntropyLoss()
    loss = loss_func(y_pred, y.cuda().long())
    loss.backward()

    saliency = x.grad.abs().squeeze().data
    print(saliency.size())
    return saliency

def show_saliency_maps(x, y, model):
    x_org = x.squeeze()
    x = torch.tensor(x)
    y = torch.tensor(y)
    # Compute saliency maps for images in X
    saliency = compute_saliency_maps(x, y, model)
    print(saliency[0,0,0])
    # Convert the saliency map from Torch Tensor to numpy array and show images
    # and saliency maps together.
    saliency = saliency.detach().cpu()

    num_pics = x_org.shape[0]
    for i in range(num_pics):
        # You need to save as the correct fig names
        plt.imsave('saliency\\pic_'+ str(i) + '.jpg', x_org[i], cmap=plt.cm.gray)
        plt.imsave('saliency\\saliency_'+ str(i) + '.jpg', saliency[i], cmap=plt.cm.jet)
        if(i == 7):
            plt.figure()
            plt.subplot(1,3,1)
            plt.imshow(x_org[i], cmap='gray')
            plt.subplot(1,3,2)
            plt.imshow(saliency[i], cmap='gray')
            #plt.colorbar()
            plt.subplot(1,3,3)
            subx = x_org[i]
            for j in range(saliency[i].size()[0]):
                for k in range(saliency[i].size()[1]):
                    if(saliency[i,j,k]*1000000 < 0.04):
                        subx[j,k] = 0
            plt.imshow(subx, cmap='gray')

# 提取不同层输出
class LayerActivations:
    features = None

    def __init__(self, model, layer_num):
        self.hook = model[layer_num].register_forward_hook(self.hook_fn)

    def hook_fn(self, module, input, output):
        self.features = output.cpu()

    def remove(self):
        self.hook.remove()

def compute_gradients(x, model, filter_model, filter_id):
    gradient = torch.zeros(x.shape)
    model.eval()
    conv_out = LayerActivations(filter_model, 0)  # 提出第 一个卷积层的输出
    o = model(x)
    conv_out.remove()  #
    act = conv_out.features  # act 即 第0层输出的特征

    activation = torch.sum(act[:,filter_id,:,:])
    activation.backward()

    gradient = x.grad.data
    return gradient

def visualize_filter(x, model, filter_model, filter_number, epochs, learning_rate):
    images = []
    for k in range(filter_number):
        for i in range(epochs):
            gradients = compute_gradients(x,model,filter_model,k)
            #self.gradients /= (torch.sqrt(torch.mean(torch.mul(self.gradients, self.gradients))) + 1e-5)
            x = x.cpu() + gradients.cpu() * learning_rate
            x = Variable(x.cuda(), requires_grad = True)
        images.append(x.cpu().detach().numpy().squeeze())
        print('Filter '+str(k+1)+' visualize over!')
    return images

def visualize_class(x, model, epochs, learning_rate):
    images = []
    for k in range(7):
        for i in range(epochs):
            gradients = torch.zeros(x.shape)
            model.eval()
            output = model(x)
            activation = output[0,k]
            activation.backward()

            gradients = x.grad.data
            x = x.cpu() + gradients.cpu() * learning_rate
            x = Variable(x.cuda(), requires_grad = True)
        images.append(x.cpu().detach().numpy().squeeze())
        print('Class '+str(k+1)+' visualize over!')
    return images

def class_judge(class_number):
    if(class_number == 0):
        out = 'angry'
    elif(class_number == 1):
        out = 'disgust'
    elif(class_number == 2):
        out = 'fear'
    elif(class_number == 3):
        out = 'happy'
    elif(class_number == 4):
        out = 'sad'
    elif(class_number == 5):
        out = 'surprise'
    elif(class_number == 6):
        out = 'natural'
    return out

def predict(input):
    return model(torch.tensor(input)[:,0:1,:,:,0].float().cuda()).cpu().detach().numpy()

def segmentation(input):
    #print(np.shape(input))
    return slic(input)


#control display image
saliency_map = 0
filter_output = 0
filter_visualization = 0
class_visualization = 0
lime = 0
model_path = 'E:\\李宏毅机器学习\\ML_code\\3expression_recognition\\3expression_recognition\\model.pth'

(x_train,y_train),(x_test,y_test)=load_data()

model = FaceCNN()
model.load_state_dict(torch.load(model_path))
model.cuda()
#print(type(model.features[0][0]))

if(saliency_map == 1):
    # using the first ten images for example
    show_saliency_maps(x_train[0:10], y_train[0:10], model)

if(filter_output == 1):
    conv_out = LayerActivations(model.features[0], 0)  # 提出第 一个卷积层的输出
    o = model(Variable(torch.tensor(x_train[0]).view(1,1,48,48).cuda()))
    conv_out.remove()  #
    act = conv_out.features  # act 即 第0层输出的特征
    # 可视化 输出
    fig1 = plt.figure(1,figsize=(20, 50))
    fig1.suptitle('Convolution layer 1 output')

    for i in range(act.size()[1]):
        ax = fig1.add_subplot(8, 8, i+1, xticks=[], yticks=[])
        ax.imshow(act[0][i].detach().numpy(), cmap="gray")

    conv_out = LayerActivations(model.features[1], 0)
    o = model(Variable(torch.tensor(x_train[0]).view(1,1,48,48).cuda()))
    conv_out.remove()  #
    act = conv_out.features  # act 即 第0层输出的特征
    # 可视化 输出
    fig3 = plt.figure(3,figsize=(20, 50))
    fig3.suptitle('Convolution layer 2 output')

    for i in range(act.size()[1]):
        ax = fig3.add_subplot(8, 16, i+1, xticks=[], yticks=[])
        ax.imshow(act[0][i].detach().numpy(), cmap="gray")

    conv_out = LayerActivations(model.features[2], 0)  # 提出第 一个卷积层的输出
    o = model(Variable(torch.tensor(x_train[0]).view(1,1,48,48).cuda()))
    conv_out.remove()  #
    act = conv_out.features  # act 即 第0层输出的特征
    # 可视化 输出
    fig5 = plt.figure(5,figsize=(20, 50))
    fig5.suptitle('Convolution layer 3 output')

    for i in range(act.size()[1]):
        ax = fig5.add_subplot(16, 16, i+1, xticks=[], yticks=[])
        ax.imshow(act[0][i].detach().numpy(), cmap="gray")

if(filter_visualization == 1):
    #initialize input x
    x = []
    for i in range(48):
        x_temp = []
        for j in range(48):
            x_temp.append(random.gauss(0,0.5))
        x.append(x_temp)
    x = np.array(x).reshape(1,1,48,48)
    x = Variable(torch.tensor(x).float().cuda(), requires_grad = True)

    newx = visualize_filter(x,model,model.features[0], 64, 100, 0.1)

    fig2 = plt.figure(2,figsize=(20, 50))
    for i in range(64):
        ax = fig2.add_subplot(8, 8, i+1, xticks=[], yticks=[])
        ax.imshow(newx[i], cmap="gray")
    fig2.suptitle('Convolution layer 1 maximizition')

    newx = visualize_filter(x,model,model.features[1], 128, 100, 0.1)

    fig4 = plt.figure(4,figsize=(20, 50))
    for i in range(128):
        ax = fig4.add_subplot(8, 16, i+1, xticks=[], yticks=[])
        ax.imshow(newx[i], cmap="gray")
    fig4.suptitle('Convolution layer 2 maximizition')

    newx = visualize_filter(x,model,model.features[2], 256, 100, 0.1)

    fig6 = plt.figure(6,figsize=(20, 50))
    for i in range(256):
        ax = fig6.add_subplot(16, 16, i+1, xticks=[], yticks=[])
        ax.imshow(newx[i], cmap="gray")
    fig6.suptitle('Convolution layer 3 maximizition')

if(class_visualization == 1):
    #initialize input x
    x = []
    for i in range(48):
        x_temp = []
        for j in range(48):
            x_temp.append(random.gauss(0,0.5))
        x.append(x_temp)
    x = np.array(x).reshape(1,1,48,48)
    x = Variable(torch.tensor(x).float().cuda(), requires_grad = True)

    newx = visualize_class(x,model, 100, 0.1)

    fig7 = plt.figure(2,figsize=(20, 50))
    for i in range(7):
        print(i,' : ',model(Variable(torch.tensor(newx[i]).view(1,1,48,48).cuda())))
        ax = fig7.add_subplot(1, 7, i+1, xticks=[], yticks=[])
        ax.set_title(class_judge(i))
        ax.imshow(newx[i], cmap="gray")
    fig7.suptitle('Class maximizition')

if(lime == 1):
    x_train_rgb = np.stack((x_train[0:10],)*3, axis=-1).squeeze()
    #x_train_rgb = Variable(torch.tensor(x_train_rgb).cuda())
    #print(x_train_rgb.size())
    # Initiate explainer instance
    print(np.shape(x_train_rgb))
    explainer = lime_image.LimeImageExplainer()

    # Get the explaination of an image
    explaination = explainer.explain_instance(
                                image=x_train_rgb[0:10],
                                classifier_fn=predict,
                                segmentation_fn=segmentation,
                            )

    # Get processed image
    image, mask = explaination.get_image_and_mask(
                                    label=explaination.top_labels[0],
                                    #torch.tensor(y_train[0:10]).long(),
                                    negative_only=False,
                                    positive_only=True,
                                    hide_rest=False,
                                    num_features=7,
                                    min_weight=0.0
                                )
    img_boundry1 = mark_boundaries(image, mask).squeeze()
    # save the image
    fig8 = plt.figure(8,figsize=(20, 50))
    for i in range(np.shape(img_boundry1)[0]):
        ax = fig8.add_subplot(2, 5, i+1, xticks=[], yticks=[])
        ax.imshow(img_boundry1[i])
    fig8.suptitle('Positive area')

    image, mask = explaination.get_image_and_mask(
                                    label=explaination.top_labels[0],
                                    #torch.tensor(y_train[0:10]).long(),
                                    negative_only=True,
                                    positive_only=False,
                                    hide_rest=False,
                                    num_features=7,
                                    min_weight=0.0
                                )
    img_boundry2 = mark_boundaries(image, mask).squeeze()
    # save the image
    fig9 = plt.figure(9,figsize=(20, 50))
    for i in range(np.shape(img_boundry2)[0]):
        ax = fig9.add_subplot(2, 5, i+1, xticks=[], yticks=[])
        ax.imshow(img_boundry2[i])
    fig9.suptitle('Negative area')

    image, mask = explaination.get_image_and_mask(
                                    label=explaination.top_labels[0],
                                    #torch.tensor(y_train[0:10]).long(),
                                    negative_only=False,
                                    positive_only=False,
                                    hide_rest=False,
                                    num_features=7,
                                    min_weight=0.0
                                )
    img_boundry3 = mark_boundaries(image, mask).squeeze()
    # save the image
    fig10 = plt.figure(10,figsize=(20, 50))
    for i in range(np.shape(img_boundry3)[0]):
        ax = fig10.add_subplot(2, 5, i+1, xticks=[], yticks=[])
        ax.imshow(img_boundry3[i])
    fig10.suptitle('Green:Positive area,Red:Negative area,Yellow:boundary')

plt.show()