商务与经济统计(13版,Python)笔记 01-02章
文章目录
- 第1章 数据与统计资料
- 1.1 统计学在商务经济中的应用
- 1.2 数据
- 1.3 数据来源
- 1.4 描述统计
- 1.5 统计推断
- 1.6 逻辑分析方法
- 1.7 大数据与数据挖掘
- 1.8 计算机与统计分析
- 1.9 统计实践的道德准则
- 第2章 描述统计学1:表格法和图形法
- 2.1 汇总分类变量的数据
- 条形图及样例(bar chart)
- 饼形图及样例(pie chart)
- 2.2 汇总数量变量的数据
- 单变量:打点图(dot plot)
- 单变量:直方图(histogram)
- 单变量:累积分布(displot)
- 单变量:茎叶显示(stem-and-leaf display)
- 2.3 用表格方法汇总两个变量的数据
- 交叉分组表(crosstabulation)
- 2.4 用图形显示方法汇总两个变量的数据
- 散点图(scatter diagram)和趋势线(trendline)
- 复合条形图(side-by-side bar chart)和结构条形图(stacked chart)
- 2.5 数据可视化:创建有效图形显示的最佳实践
- 创建有效的图形显示
第一次读本书的时候,因为有大学课程的基础,更关注于技术性的内容和理解,而忽略了看似简单的基础知识。实际上这应该是入门新手的通病,总是着眼于实用性内容,而忽略基础知识。虽然这样做有助于维持学习兴趣,帮助新人坚持到入门,然后在实践之中反过来学习基础知识。但是最好在第一次学习就能认识到基础知识的重要性,并且尽量掌握。最好的办法就是做习题。
最初是为了学习数据分析,然而当业内人士说数据分析最重要的知识是‘描述统计学’,我记忆中却是将其归为显浅知识,囫囵吞枣。
第1章 数据与统计资料
1.1 统计学在商务经济中的应用
会计、财务、市场营销、生产、经济、信息系统
1.2 数据
数据、数据集、个体、变量、观测值、分类型数据、分类变量、数量型数据、数量变量、截面数据、时间序列数据
**1.2.2 测量尺度**
名义尺度、顺序尺度、间隔尺度、比率尺度按顺序层层包含
其中,顺序尺度加减无意义,间隔尺度乘除无意义,只有间隔尺度、比例尺度有计量单位 测量尺度
1.3 数据来源
来源有:现有来源、观测性研究、实验,需要注意:时间与成本问题、数据采集误差
1.4 描述统计
将数据以表格、图形或数值形式汇总的统计方法
1.5 统计推断
总体、样本、普查、抽样调查
统计学的一个主要贡献就是利用样本数据对总体特征进行估计和假设检验,即统计推断
1.6 逻辑分析方法
逻辑分析方法包括:
描述性分析对过去数据的分析、BI、或复盘
预测性分析预测,或指出变量之间的影响
规范性分析产生一个最佳行动过程的分析技术集合,即在实际条件约束情况下的行动指导
1.7 大数据与数据挖掘
大数据容量(volume)、速度(velocity)、种类(variety),3V
数据挖掘data mining,从庞大的数据库中自动提取预测性的信息
1.8 计算机与统计分析
1.9 统计实践的道德准则
统计是搜集、分析、表述、和解析数据的艺术和科学
第2章 描述统计学1:表格法和图形法
2.1 汇总分类变量的数据
频数分布、相对频数分布、百分比频数分布
条形图及样例(bar chart)
条形图(bar chat)描述:频数分布、相对频数分布、百分比频数分布,分类变量的条形图,应该有一定的间隔
matplotlib.bar(有样例) 基本用法:
from matplotlib import pyplot as plt
x,y,x2,y2=  [5,8,10] ,[12,16,6],[6,9,11] ,[6,15,7]
plt.bar(x, y, align =  'center')
plt.bar(x2, y2, color =  'g', align =  'center')
plt.title('Bar graph')
plt.ylabel('Y axis')
plt.xlabel('X axis')
plt.show()
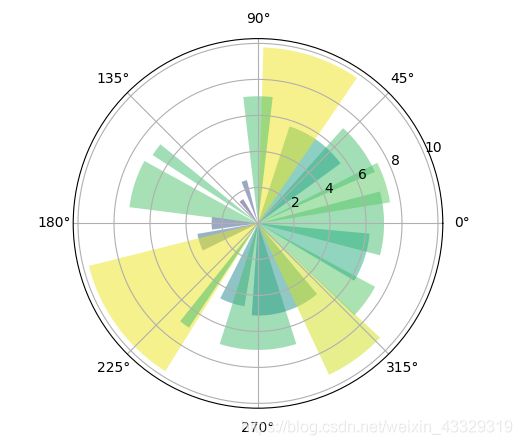
import numpy as np
import matplotlib.pyplot as plt
np.random.seed(19680801)
N = 20
theta = np.linspace(0.0, 2 * np.pi, N, endpoint=False)
radii = 10 * np.random.rand(N)
width = np.pi / 4 * np.random.rand(N)
colors = plt.cm.viridis(radii / 10.)
ax = plt.subplot(111, projection='polar')
ax.bar(theta, radii, width=width, bottom=0.0, color=colors, alpha=0.5)
plt.show()
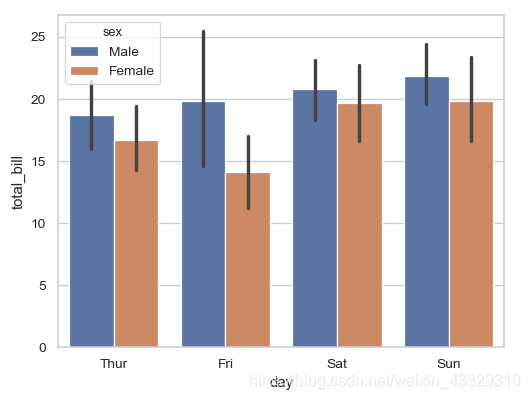
ax = sns.barplot(x="day", y="total_bill", hue="sex", data=tips)
饼形图及样例(pie chart)
饼形图(pie chat)描述:相对频数分布、百分比频数分布(相对角度差异,人更能判断长度间的差异,所以最好标注比例)
matplotlib.pyplot.pie(有样例),个人觉得不错的3各样例(后附代码):

import matplotlib.pyplot as plt
labels = 'Frogs', 'Hogs', 'Dogs', 'Logs'
sizes = [15, 30, 45, 10]
explode = (0, 0.1, 0, 0)  # only "explode" the 2nd slice (i.e. 'Hogs')
fig1, ax1 = plt.subplots()
ax1.pie(sizes, explode=explode, labels=labels, autopct='%1.1f%%',
        shadow=True, startangle=90)
ax1.axis('equal')  # Equal aspect ratio ensures that pie is drawn as a circle.
plt.show()
import numpy as np
import matplotlib.pyplot as plt
fig, ax = plt.subplots(figsize=(6, 3), subplot_kw=dict(aspect="equal"))
recipe = ["375 g flour","75 g sugar","250 g butter","300 g berries"]
data = [float(x.split()[0]) for x in recipe]
ingredients = [x.split()[-1] for x in recipe]
def func(pct, allvals):
    absolute = int(pct/100.*np.sum(allvals))
    return "{:.1f}%\n({:d} g)".format(pct, absolute)
wedges, texts, autotexts = ax.pie(data, autopct=lambda pct: func(pct, data),
                                  textprops=dict(color="w"))
ax.legend(wedges, ingredients,
          title="Ingredients",
          loc="center left",
          bbox_to_anchor=(1, 0, 0.5, 1))
plt.setp(autotexts, size=8, weight="bold")
ax.set_title("Matplotlib bakery: A pie")
plt.show()
fig, ax = plt.subplots(figsize=(6, 3), subplot_kw=dict(aspect="equal"))
recipe = ["225 g flour","90 g sugar","1 egg","60 g butter","100 ml milk","1/2 package of yeast"]
data = [225, 90, 50, 60, 100, 5]
wedges, texts = ax.pie(data, wedgeprops=dict(width=0.5), startangle=-40)
bbox_props = dict(boxstyle="square,pad=0.3", fc="w", ec="k", lw=0.72)
kw = dict(arrowprops=dict(arrowstyle="-"),
          bbox=bbox_props, zorder=0, va="center")
for i, p in enumerate(wedges):
    ang = (p.theta2 - p.theta1)/2. + p.theta1
    y = np.sin(np.deg2rad(ang))
    x = np.cos(np.deg2rad(ang))
    horizontalalignment = {-1: "right", 1: "left"}[int(np.sign(x))]
    connectionstyle = "angle,angleA=0,angleB={}".format(ang)
    kw["arrowprops"].update({"connectionstyle": connectionstyle})
    ax.annotate(recipe[i], xy=(x, y), xytext=(1.35*np.sign(x), 1.4*y),
                horizontalalignment=horizontalalignment, **kw)
ax.set_title("Matplotlib bakery: A donut")
plt.show()
Pandas 画图一个函数应该够用了,参数详解
DataFrame.plot(x=None, y=None, kind='line', ax=None, subplots=False,
                sharex=None, sharey=False, layout=None,figsize=None,
                use_index=True, title=None, grid=None, legend=True,
                style=None, logx=False, logy=False, loglog=False,
                xticks=None, yticks=None, xlim=None, ylim=None, rot=None,
                xerr=None,secondary_y=False, sort_columns=False, **kwds)
样例 Matplotlib examples
样例 Seaborn Example gallery
2.2 汇总数量变量的数据
组数、组宽、组限、组中值、相对频数分布、百分比频数分布、累积频数分布
单变量:打点图(dot plot)
使用 matplotlib.scatter,seaborn.swarmplot模拟

import numpy as np
import matplotlib.pyplot as plt
import seaborn as sns
import pandas as pd

from matplotlib.pyplot import MultipleLocator
fig,ax=plt.subplots(1,2,figsize=(12,2))
np.random.seed(1900)
x=np.random.randint(1,99,size=20)
data=pd.DataFrame(x,columns=['x'])
data['y']=1
for i in range(len(data)):
    data['y'].at[i]=data['x'].iloc[:i+1][data['x'].iloc[:i+1]==data['x'].at[i]].count()
plt.subplot(121)

plt.scatter(data['x'],data['y'])
plt.tick_params(axis='both',which='major')
#刻度设置
# y_major_locator=MultipleLocator(1)
# x_major_locator=MultipleLocator(10)
# ax[0]=plt.gca()
# ax[0].xaxis.set_major_locator(y_major_locator)
# ax[0].xaxis.set_major_locator(x_major_locator)
sns.swarmplot(x="x", y="y",palette=["r", "c", "y"],data=data,ax=ax[1])
plt.show()
单变量:直方图(histogram)
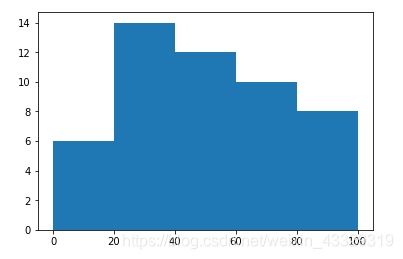
与条形图原理一样,只是数量型变量进行分组,方条之间无间隔
from matplotlib import pyplot as plt
import numpy as np
np.random.seed(1900)
x=np.random.randint(1,99,size=50)
plt.hist(x, bins =  [0,20,40,60,80,100])
plt.show()
单变量:累积分布(displot)
累积分布如果使用matplotlib则需要计算累积量,使用seaborn.displot,一口气能画4张图Distribution plot options
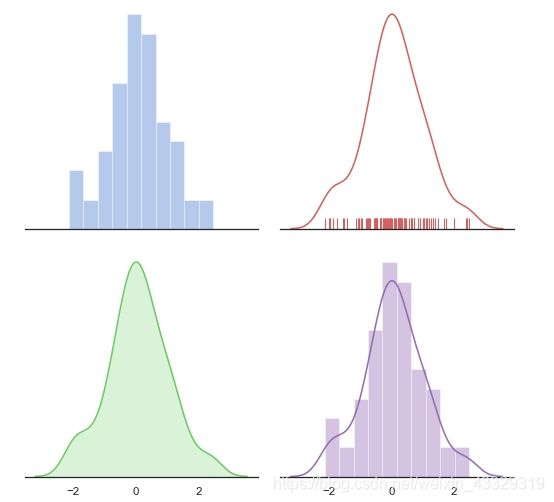
import numpy as np
import seaborn as sns
import matplotlib.pyplot as plt
sns.set(style="white", palette="muted", color_codes=True)
rs = np.random.RandomState(10)
f, axes = plt.subplots(2, 2, figsize=(7, 7), sharex=True)
sns.despine(left=True)
d = rs.normal(size=100)
sns.distplot(d, kde=False, color="b", ax=axes[0, 0])
sns.distplot(d, hist=False, rug=True, color="r", ax=axes[0, 1])
sns.distplot(d, hist=False, color="g", kde_kws={"shade": True}, ax=axes[1, 0])
sns.distplot(d, color="m", ax=axes[1, 1])
plt.setp(axes, yticks=[])
plt.tight_layout()
单变量:茎叶显示(stem-and-leaf display)
暂时没找到茎叶图的库,手动实现
0 | 6 9 8 4
1 | 6 3 7 3 6 1 2
2 | 5 5 9 2
3 | 2 8 0 4
4 | 9 9
5 | 1 5 2 4 9 8 6
6 | 3 6 2
7 | 3 2 1 2
8 | 9 4 1 3 0 7 7 1 9 3 1
9 | 6 2 7 8
import numpy as np
np.random.seed(2019)
data=np.random.randint(1,99,size=50)
_stem=[]
for x in data:
    _stem.append(x//10)
    stem=list(set(_stem))
for m in stem:
    leaf=[]
    leaf.append(m)
    for n in data:
        if n//10==m:
            leaf.append(n%10)
    print(leaf[0],'|',end=' ')
    for i in range(1,len(leaf)):
        print(leaf[i],end=' ')
    print('\n')
2.3 用表格方法汇总两个变量的数据
辛普森悖论:依据综合和未综合的数据得到相反的结论。(原因是未综合的变量,本身权重不等)
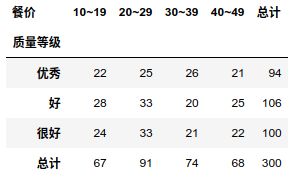
交叉分组表(crosstabulation)
import numpy as np
import pandas as pd
np.random.seed(900)
y=np.random.randint(0,3,size=300)
z=np.random.randint(11,49,size=300)
data=pd.DataFrame({'质量等级':y,'餐价':z})
data['质量等级'].replace({0:'好',1:'很好',2:'优秀'},inplace=True)
bins=[10,19,29,39,49]
quartiles = pd.cut(data['餐价'], bins,labels=['10~19','20~29','30~39','40~49'])
data['餐价']=quartiles
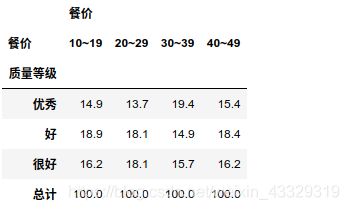
pd.crosstab(data['质量等级'],data['餐价'],margins=True,margins_name='总计')
2.4 用图形显示方法汇总两个变量的数据
散点图(scatter diagram)和趋势线(trendline)
帅气的散点图(matplotlib中,趋势线要用numpy.ployfit函数):
import matplotlib.pyplot as plt
import numpy as np
np.random.seed(19680801)
x = np.arange(0.0, 50.0, 2.0)
y = x ** 1.3 + np.random.rand(*x.shape) * 30.0
s = np.random.rand(*x.shape) * 800 + 500
colors = np.random.rand(*x.shape)
plt.figure(figsize=(12,6))
plt.scatter(x, y, s,  c=colors,alpha=0.5, marker=r'$\clubsuit$',
            label="Luck")
p1 = np.poly1d(np.polyfit(x, y, 1))
l1=plt.plot(x,p1(x),'r--',label='trendline')
plt.xlabel("Leprechauns")
plt.ylabel("Gold")
plt.legend(loc='upper left')
plt.show()
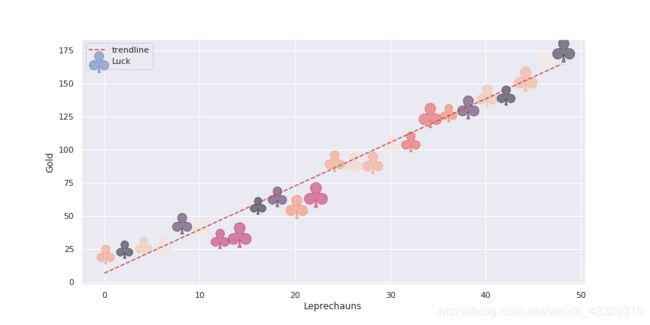
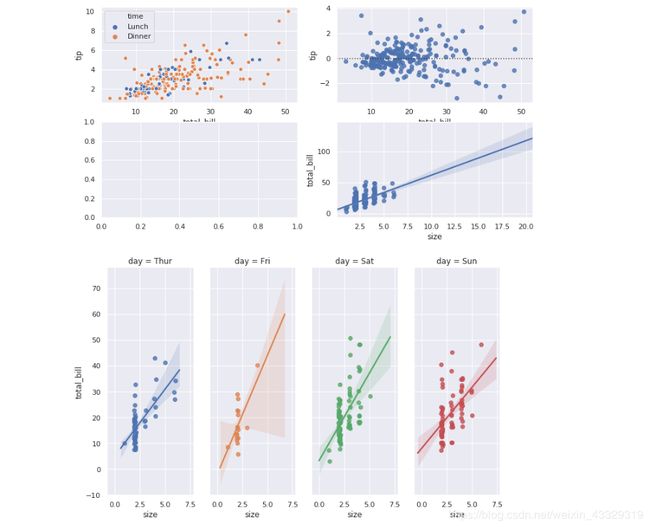
使用seaborn库则可以更加绚丽(sns.jointplot太占位置了,没画):
import seaborn as sns; sns.set()
import matplotlib.pyplot as plt
fig,axes=plt.subplots(2,2,figsize=(12,6))
tips = sns.load_dataset("tips")
cmap = sns.cubehelix_palette(dark=.3, light=.8, as_cmap=True)
sns.scatterplot(x="total_bill", y="tip",hue="time", data=tips,ax=axes[0,0])
sns.residplot(x="total_bill", y="tip",  data=tips,ax=axes[0,1])
sns.regplot(x="size", y="total_bill", data=tips, x_jitter=.1,ax=axes[1,1])
sns.lmplot(x="size", y="total_bill", hue="day", col="day",
             data=tips, height=6, aspect=.4, x_jitter=.1)
#sns.jointplot("total_bill", "tip", data=tips, kind="reg",
#              xlim=(0, 60), ylim=(0, 12), color="m", height=7)
复合条形图(side-by-side bar chart)和结构条形图(stacked chart)
matplotlib做这种复合图,有点复杂,附上链接
Stacked Bar Graph
Grouped bar chart with labels
Discrete distribution as horizontal bar chart
首先使用,pandas画图,还是2.3模拟表格的数字,这次用groupby聚合,然后增加汇总,转置
import numpy as np
import pandas as pd
import matplotlib.pyplot as plt
pd.set_option('precision',1)#设置小数位
np.random.seed(900)
y=np.random.randint(0,3,size=300)
z=np.random.randint(11,49,size=300)
data=pd.DataFrame({'质量等级':y,'餐价':z})
data['质量等级'].replace({0:'好',1:'很好',2:'优秀'},inplace=True)
bins=[10,19,29,39,49]
quartiles = pd.cut(data['餐价'], bins,labels=['10~19','20~29','30~39','40~49'])
df=data.groupby(['质量等级',quartiles]).count().unstack()
df=df.apply(lambda x: x/x.sum()*100)
df.loc['总计'] = df.apply(lambda x: x.sum())#总计,作图时候不需要
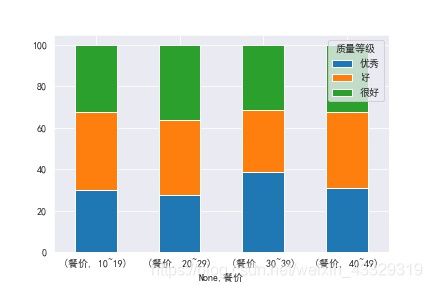
df.T.plot(kind='bar',stacked=True)
import matplotlib.pyplot as plt
import seaborn as sns
sns.set(style="darkgrid")
fig,(ax1,ax2)=plt.subplots(1,2,figsize=(12,6))
tips = sns.load_dataset("tips")
sns.countplot(y="day", hue="sex", data=tips,ax=ax1)
sns.barplot(x="day", y="total_bill", data=tips,ax=ax2)
sns.catplot(x="sex", y="total_bill",hue="smoker", col="time",data=tips, kind="bar",height=4, aspect=.7)
g = sns.FacetGrid(tips, row="sex", col="time", margin_titles=True)
bins = np.linspace(0, 60, 13)
g.map(plt.hist, "total_bill", color="steelblue", bins=bins)
import seaborn as sns
import matplotlib.pyplot as plt
sns.set(style="whitegrid")
f, ax = plt.subplots(figsize=(15, 6))
crashes = sns.load_dataset("car_crashes").sort_values("total", ascending=False)
sns.set_color_codes("pastel")
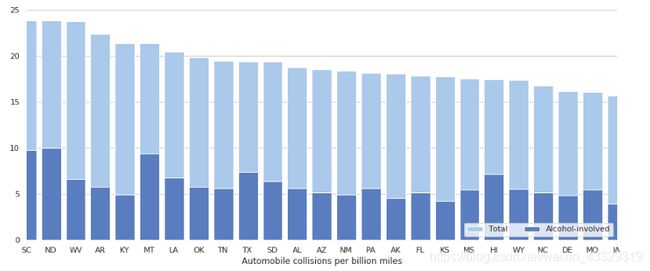
sns.barplot(y="total", x="abbrev", data=crashes,
            label="Total", color="b")
sns.set_color_codes("muted")
sns.barplot(y="alcohol", x="abbrev", data=crashes,
            label="Alcohol-involved", color="b")
ax.legend(ncol=2, loc="lower right", frameon=True)
ax.set(xlim=(0, 24), ylabel="",
       xlabel="Automobile collisions per billion miles")
sns.despine(left=True, bottom=True)
2.5 数据可视化:创建有效图形显示的最佳实践
创建有效的图形显示
1、给予图形显示一个清晰、简明的标题。
2、使图形显示保持简洁,当能用二维表示时不要用三维表示。
3、每个坐标有清楚的标记,并给出测量单位。
4、如果使用颜色来区分类别,要确保颜色是不同的。
5、如果使用多种颜色或线型,用图例来标明时,要将图例靠近所表示的数据。

