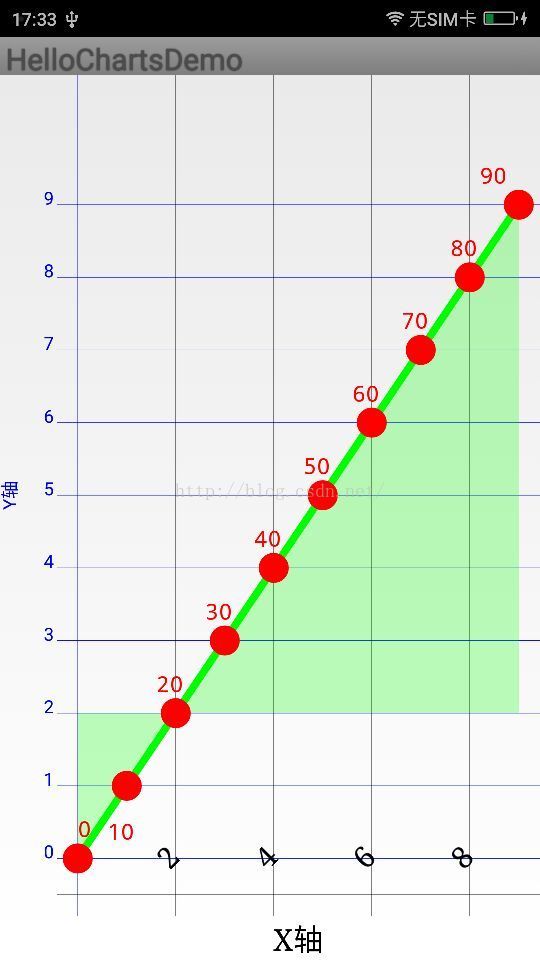
HelloCharts(一、LineChart)
HelloCharts控件里的LineChart方法设置
布局文件
import java.util.ArrayList;
import java.util.List;

import android.app.Activity;
import android.graphics.Color;
import android.graphics.Typeface;
import android.os.Bundle;
import android.widget.Toast;
import lecho.lib.hellocharts.animation.ChartAnimationListener;
import lecho.lib.hellocharts.listener.LineChartOnValueSelectListener;
import lecho.lib.hellocharts.model.Axis;
import lecho.lib.hellocharts.model.AxisValue;
import lecho.lib.hellocharts.model.Line;
import lecho.lib.hellocharts.model.LineChartData;
import lecho.lib.hellocharts.model.PointValue;
import lecho.lib.hellocharts.model.ValueShape;
import lecho.lib.hellocharts.model.Viewport;
import lecho.lib.hellocharts.view.LineChartView;

public class LineDemo extends Activity {

	static int LineChartNums = 10;
	int numberOfLines = 1;
	int maxNumberOfLines = 4;
	boolean isCubic = false;

	LineChartView lineChart;

	private LineChartData chartData;

	@Override
	protected void onCreate(Bundle savedInstanceState) {
		super.onCreate(savedInstanceState);
		setContentView(R.layout.linedemo);

		lineChart = (LineChartView) findViewById(R.id.linechart);
		lineChart.setInteractive(true);//是否可以缩放
		lineChart.setOnValueTouchListener(new LineChartOnValueSelectListener() {

			@Override
			public void onValueDeselected() {

			}

			@Override
			public void onValueSelected(int arg0, int arg1, PointValue arg2) {
				Toast.makeText(LineDemo.this, arg1+"", 0).show();
				//addLineToData();
				resetViewport();
			}
		});
		lineChart.setValueSelectionEnabled(true);//设置节点点击后动画
		toggleCubic();
	}

	/**
	 * 添加数据
	 */
	public void AddLineChartDate(){

		List lines = new ArrayList();
		for (int i = 0; i < numberOfLines; i++) {
			List pointValues = new ArrayList();//节点数据结合
			Axis axisY = new Axis();//Y轴属性
			Axis axisX = new Axis();//X轴属性
			axisY.setName("Y轴");
			axisX.setName("X轴");
			ArrayList axisValuesY = new ArrayList();
			ArrayList axisValuesX = new ArrayList();
			for (int j = 0; j < LineChartNums; j++) {
				pointValues.add(new PointValue(j, j*10*(i+1)));//添加节点数据
				axisValuesY.add(new AxisValue(j*10*(i+1)).setLabel(j+""));//添加Y轴显示的刻度值
				axisValuesX.add(new AxisValue(j).setLabel(j+""));//添加X轴显示的刻度值
			}
			axisY.setValues(axisValuesY);
			axisX.setValues(axisValuesX);
			axisX.setLineColor(Color.BLACK);//无效果
			axisY.setLineColor(Color.BLUE);//无效果

			axisX.setTextColor(Color.BLACK);//设置X轴文字颜色
			axisY.setTextColor(Color.BLUE);//设置Y轴文字颜色

			axisX.setTextSize(20);//设置X轴文字大小
			axisX.setTypeface(Typeface.SERIF);//设置文字样式

			axisX.setHasTiltedLabels(true);//设置X轴文字向左旋转45度
			axisX.setHasLines(true);//是否显示X轴网格线
			axisY.setHasLines(true);


			axisX.setInside(true);//设置X轴文字在X轴内部


			Line line = new Line(pointValues);
			line.setColor(Color.GREEN);//设置折线颜色
			line.setStrokeWidth(5);//设置折线宽度
			line.setFilled(true);//设置折线覆盖区域颜色
			line.setCubic(isCubic);//节点之间的过渡
			line.setPointColor(Color.RED);//设置节点颜色
			line.setPointRadius(10);//设置节点半径
			line.setHasLabels(true);//是否显示节点数据
			line.setHasLines(true);//是否显示折线
			line.setHasPoints(true);//是否显示节点
			line.setShape(ValueShape.CIRCLE);//节点图形样式 DIAMOND菱形、SQUARE方形、CIRCLE圆形
			line.setHasLabelsOnlyForSelected(false);//隐藏数据,触摸可以显示
			lines.add(line);//将数据集合添加到线

			chartData = new LineChartData(lines);
			chartData.setAxisYLeft(axisY);//将Y轴属性设置到左边
			chartData.setAxisXBottom(axisX);//将X轴属性设置到底部
			chartData.setBaseValue(20);//设置反向覆盖区域颜色
			chartData.setValueLabelBackgroundAuto(false);//设置数据背景是否跟随节点颜色
			chartData.setValueLabelBackgroundColor(Color.BLUE);//设置数据背景颜色
			chartData.setValueLabelBackgroundEnabled(false);//设置是否有数据背景
			chartData.setValueLabelsTextColor(Color.RED);//设置数据文字颜色
			chartData.setValueLabelTextSize(15);//设置数据文字大小
			chartData.setValueLabelTypeface(Typeface.MONOSPACE);//设置数据文字样式
		}


		lineChart.setLineChartData(chartData);//将数据添加到控件中
	}

	private void resetViewport() {
        // Reset viewport height range to (0,100)
        final Viewport v = new Viewport(lineChart.getMaximumViewport());
        v.bottom = 0;
        v.top = 100;
        v.left = 0;
        v.right = LineChartNums - 1;
        lineChart.setMaximumViewport(v);
        lineChart.setCurrentViewport(v);
    }

	 private void toggleCubic() {
         isCubic = !isCubic;

         AddLineChartDate();

         if (isCubic) {
             final Viewport v = new Viewport(lineChart.getMaximumViewport());
             v.bottom = -5;
             v.top = 105;
             lineChart.setMaximumViewport(v);
             lineChart.setCurrentViewportWithAnimation(v);
         } else {
             // If not cubic restore viewport to (0,100) range.
             final Viewport v = new Viewport(lineChart.getMaximumViewport());
             v.bottom = 0;
             v.top = 100;
             lineChart.setViewportAnimationListener(new ChartAnimationListener() {

                 @Override
                 public void onAnimationStarted() {
                     // TODO Auto-generated method stub

                 }

                 @Override
                 public void onAnimationFinished() {
                	 lineChart.setMaximumViewport(v);
                	 lineChart.setViewportAnimationListener(null);

                 }
             });
             lineChart.setCurrentViewportWithAnimation(v);
         }

     }

}

jar包 点击打开链接