echarts横向柱状图以及排列
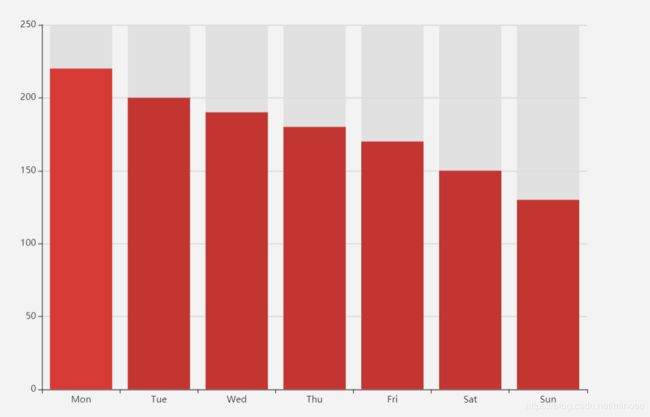
先说一下纵向柱状图,拿一个文档的demo,效果如下图。
option = {
    xAxis: { //x轴
        type: 'category',
        data: ['Mon', 'Tue', 'Wed', 'Thu', 'Fri', 'Sat', 'Sun']
    },
    yAxis: { //y轴
        type: 'value'
    },
    series: [{
        data: [220, 200, 190, 180, 170, 150, 130],
        type: 'bar',
        showBackground: true,
        backgroundStyle: {
            color: 'rgba(220, 220, 220, 0.8)'
        }
    }]
};

x轴的type为 ‘category’, y轴type为’value’
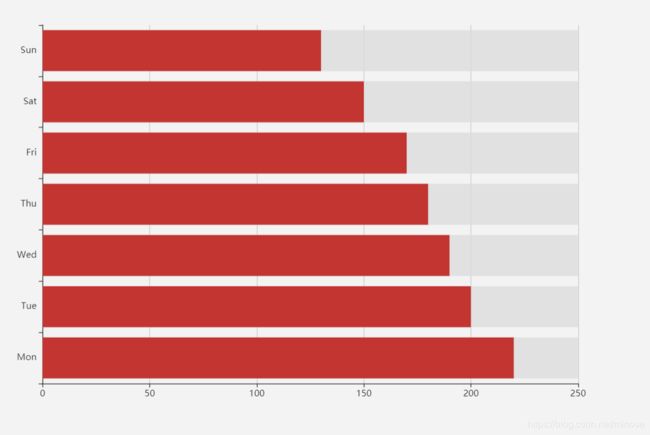
变成横向的只需将x,y的type类型交换即可,效果如下图
option = {
    yAxis: { //y轴
        type: 'category',
        data: ['Mon', 'Tue', 'Wed', 'Thu', 'Fri', 'Sat', 'Sun']
    },
    xAxis: { //x轴
        type: 'value'
    },
    series: [{
        data: [220, 200, 190, 180, 170, 150, 130],
        type: 'bar',
        showBackground: true,
        backgroundStyle: {
            color: 'rgba(220, 220, 220, 0.8)'
        }
    }]
};
此时已经变成横向的展示了。虽然给的data是降序排列的,但是此时最小值在顶部就很尴尬,当然我们可以直接在后台给一个升序排列的序列,这样最大值就在顶部了。
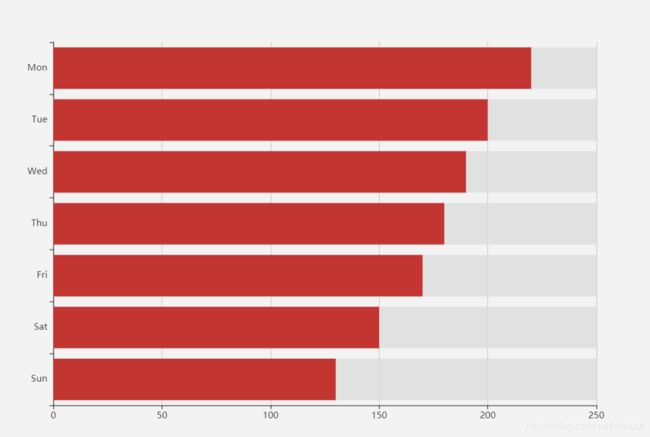
或者我们可以在yAxis中设置inverse: true,即
option = {
    yAxis: {
        type: 'category',
        data: ['Mon', 'Tue', 'Wed', 'Thu', 'Fri', 'Sat', 'Sun'],
             inverse: true, //使y轴翻转
    },
    xAxis: {
        type: 'value',

    },
    series: [{
        data: [220, 200, 190, 180, 170, 150, 130],
        type: 'bar',
        showBackground: true,
        backgroundStyle: {
            color: 'rgba(220, 220, 220, 0.8)'
        }
    }]
};

