pandas总结与思维导图
- 引言
- pandas语法
- pandas基础思维导图
- broadcasting机制
- pandas索引
- 时间序列索引
- DataFrame 多重索引
- 索引思维导图
- 数据清洗与预处理
- 数据清理
- 数据预处理
- 数据可视化
- 总结
引言
本篇博文是对于 实验楼 里pandas语法的一个实验,叫Pandas 百题大冲关,再加上一些我自己从前遇到过的一些问题,还有很多自己的一些见解,然后在这里做一个总结。
pandas语法
pandas基础思维导图
因为前面的东西比较基础,有些东西太散了,而且比较偏门,我就做了一个思维导图来分析了一下,顺便查阅了很多资料,补充了一些我之前没有去注意到的点:
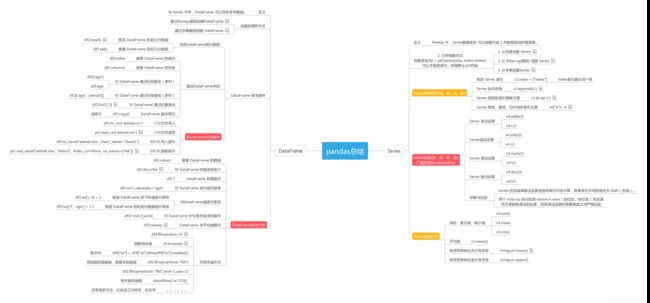
标记红色部分是我觉得重要的,日常分析中经常用的,而橙色相对次之,稍微比红色用得少些。关于缺失值的处理,这个方法蛮多的,但百题中只有去除和插值。我一般是使用取平均的方式,或者拟合,这里也在上述流程图中补充了我的一些想法,比如说还有三次样条插值,中位数等等,有些还需要是具体情况而定。另外这里有一个机制,叫做broadcasting,下面就来介绍一下。
broadcasting机制
我们常常会看到 python 编译器会提示如下类型的错误:
ValueError: operands could not be broadcast together with shapes (8,4,3) (2,1)
broadcasting机制的功能是为了方便不同shape的array(numpy库的核心数据结构)进行数学运算。
从官网看到的规则翻译成中文则是:
- 让所有输入数组都向其中shape最长的数组看齐,shape中不足的部分都通过在前面加1补齐
- 输出数组的shape是输入数组shape的各个轴上的最大值
- 如果输入数组的某个轴和输出数组的对应轴的长度相同或者其长度为1时,这个数组能够用来计算,否则出错
- 当输入数组的某个轴的长度为1时,沿着此轴运算时都用此轴上的第一组值
用代码来理解,即是:
>>> a = np.array([1,2,3])
# b = np.array([2,2,2]) --> a*b	# 维度一致,python类列表做法
b = 2	# numpy中的broadcast形式
print(a*b)
array([2,4,6])
而如果维度不一致,那么就会报上面的那个错:
a = np.array([1,2,3])
b = np.array([1,2,3,1,2,3])
a*b

ValueError: operands could not be broadcast together with shapes (3,) (6,)
另外这里需要说的是,关于矩阵与整数的加减乘除法,其实就是矩阵点乘了这个整数,即矩阵内的每个数都与整数进行了运算,而如果是两个数组矩阵,就相当于是按照矩阵乘法的运算:
- 一维数组置于矩阵乘法的左部,被视为一个行向量;
- 一维数组置于矩阵乘法的右部,被视为一个列向量;
也就是左行右列的原则。
pandas索引
关于索引,这个还是蛮重要的,不论是在数据库,还是在数据结构,都是无可替代的东西。在打比赛的时候用得也很多,尤其是时间序列索引和DataFrame索引,下面我们就来介绍这两个的索引。
时间序列索引
- 建立一个以 2018 年每一天为索引,值为随机数的 Series:
>>> dti = pd.date_range(start="2018-01-01",end="2018-12-31",freq="D")
s = pd.Series(np.random.rand(len(dti)),index=dti)
s
--------------------------------------
“”“
2018-01-01    0.084896
2018-01-02    0.914417
2018-01-03    0.285811
2018-01-04    0.945080
				......
2018-12-31    0.446219
”“”
- 统计s 中每一个周三对应值的和:
>>> print(s[s.index.weekday == 2])
>>> s[s.index.weekday == 2].sum() # # 周一从 0 开始
--------------------------------------
“”“
2018-01-03    0.892325
2018-01-10    0.917178
2018-01-17    0.051205
				......
2018-12-26    0.403411
dtype: float64
25.810026230589507
”“”
- 统计s中每个月值的平均值:
>>> s.resample('M').mean()
--------------------------------------
“”“
2018-01-31    0.454337
2018-02-28    0.677720
2018-03-31    0.455357
2018-04-30    0.487341
2018-05-31    0.488349
2018-06-30    0.481850
2018-07-31    0.537994
2018-08-31    0.524359
2018-09-30    0.568155
2018-10-31    0.521819
2018-11-30    0.479967
2018-12-31    0.499142
Freq: M, dtype: float64
”“”
- 将 Series 中的时间进行转换:
s = pd.date_range('today', periods=100, freq='S')

ts = pd.Series(np.random.randint(0, 500, len(s)), index=s)

ts.resample('Min').sum()
--------------------------------------
“”“
2018-12-05 11:06:00      715
2018-12-05 11:07:00    16033
2018-12-05 11:08:00     8611
Freq: T, dtype: int64
”“”
DataFrame 多重索引
关于DataFrame的索引,很多都是很重要的,在这里我就列举一部分来分析它的
- 多重索引求和:
>>> frame = pd.DataFrame(np.arange(12).reshape(6, 2),
                     index=[list('AAABBB'), list('123123')],
                     columns=['hello', 'shiyanlou'])
frame	# 创建一个在0-12之间六行两列的数组,然后加上AAABBB的索引,也就是A、B两类索引

>>>frame.groupby('first').sum()
| first | hello | shiyanlou |
|---|---|---|
| A | 6 | 9 |
| B | 24 | 27 |
- DataFrame条件查找
>>> data = {'animal': ['cat', 'cat', 'snake', 'dog', 'dog', 'cat', 'snake', 'cat', 'dog', 'dog'],
        'age': [2.5, 3, 0.5, np.nan, 5, 2, 4.5, np.nan, 7, 3],
        'visits': [1, 3, 2, 3, 2, 3, 1, 1, 2, 1],
        'priority': ['yes', 'yes', 'no', 'yes', 'no', 'no', 'no', 'yes', 'no', 'no']}

labels = ['a', 'b', 'c', 'd', 'e', 'f', 'g', 'h', 'i', 'j']
df = pd.DataFrame(data, index=labels)

>>>df[df['age'] > 3]
| / | animal | age | visits | priority |
|---|---|---|---|---|
| e | dog | 5.0 | 2 | no |
| g | snake | 4.5 | 1 | no |
| i | dog | 7.0 | 2 | no |
- DataFrame多重条件查询
>>> df = pd.DataFrame(data, index=labels)

df[(df['animal'] == 'cat') & (df['age'] < 3)]
| / | animal | age | visits | priority |
|---|---|---|---|---|
| a | cat | 2.5 | 1 | yes |
| f | cat | 2.0 | 3 | no |
- DataFrame 按关键字查询
>>> df3[df3['animal'].isin(['cat', 'dog'])]
| / | animal | age | visits | priority |
|---|---|---|---|---|
| a | cat | 2.5 | 1 | yes |
| b | cat | 3.0 | 3 | yes |
| d | dog | NaN | 3 | yes |
| e | dog | 5.0 | 2 | no |
| f | cat | 2.0 | 3 | no |
| h | cat | NaN | 1 | yes |
| i | dog | 7.0 | 2 | no |
| j | dog | 3.0 | 1 | no |
- DataFrame 多条件排序
按照 age 降序,visits 升序排列
>>> df.sort_values(by=['age', 'visits'], ascending=[False, True])
| / | animal | age | visits | priority |
|---|---|---|---|---|
| i | dog | 7.0 | 2 | no |
| e | dog | 5.0 | 2 | no |
| g | snake | 4.5 | 1 | no |
| j | dog | 3.0 | 1 | no |
| b | cat | 3.0 | 3 | yes |
| a | cat | 2.5 | 1 | yes |
| f | cat | 2.0 | 3 | no |
| c | snake | 0.5 | 2 | no |
| h | cat | NaN | 1 | yes |
| d | dog | NaN | 3 | yes |
- DataFrame 分组求和
>>> df.groupby('animal').sum()
| animal | age | visits |
|---|---|---|
| cat | 7.5 | 8 |
| dog | 15.0 | 8 |
| snake | 5.0 | 3 |
- DataFrame 多值替换
将 priority 列的 yes 值替换为 True,no 值替换为 False
>>> df['priority'].map({'yes': True, 'no': False})
- 使用列表拼接多个 DataFrame
temp_df1 = pd.DataFrame(np.random.randn(5, 4))  # 生成由随机数组成的 DataFrame 1
temp_df2 = pd.DataFrame(np.random.randn(5, 4))  # 生成由随机数组成的 DataFrame 2
temp_df3 = pd.DataFrame(np.random.randn(5, 4))  # 生成由随机数组成的 DataFrame 3

print(temp_df1)
print(temp_df2)
print(temp_df3)

pieces = [temp_df1, temp_df2, temp_df3]
pd.concat(pieces)
然后还有找出表中和最小的那一列,每一组中最大的三个数的和等等这些,用得不多,所以总结在下面的这张思维导图里。
索引思维导图

里面介绍了一些上面没有讲到的,然后还是和上面的思维导图一样,红色是我认为重要的,橙色次之。
数据清洗与预处理
数据清理
在FilghtNumber中有数值缺失,其中数值为按 10 增长,补充相应的缺省值使得数据完整,并让数据为 int 类型,这可以算作是一种基本的拟合。
df = pd.DataFrame({'From_To': ['LoNDon_paris', 'MAdrid_miLAN', 'londON_StockhOlm',
'Budapest_PaRis', 'Brussels_londOn'],
'FlightNumber': [10045, np.nan, 10065, np.nan, 10085],
'RecentDelays': [[23, 47], [], [24, 43, 87], [13], [67, 32]],
'Airline': ['KLM(!)', ' (12)' , '(British Airways. )',
'12. Air France', '"Swiss Air"']})
df['FlightNumber'] = df['FlightNumber'].interpolate().astype(int)
df
| / | From_To | FlightNumber | RecentDelays | Airline |
|---|---|---|---|---|
| 0 | LoNDon_paris | 10045 | [23, 47] | KLM(!) |
| 1 | MAdrid_miLAN | 10055 | [] | < Air France>(12) |
| 2 | londON_StockhOlm | 10065 | [24, 43, 87] | (British Airways. ) |
| 3 | Budapest | PaRis | 10075 | [13] |
| 4 | Brussels_londOn | 10085 | [67, 32] | “Swiss Air” |
然后我们可以通过:
- 数据列拆分,因为其中From_to应该为两独立的两列From和To,将From_to依照_拆分为独立两列建立为一个新表
- 然后再进行字符标准化,因为注意到地点的名字都不规范(如:londON应该为London)需要对数据进行标准化处理
- 再将最开始的From_to列删除,加入整理好的From和to列(这一步我感觉就是将一个特征拆成两个吧,感觉适用场景很少,不会有那么凑巧的列名和数据都能直接拆)
- 最后去除多余字符,如同 airline 列中许多数据有许多其他字符,会对后期的数据分析有较大影响,需要对这类数据进行修正。
“”“数据拆分”“”
temp = df.From_To.str.split('_', expand=True)
temp.columns = ['From', 'To']
# print(temp)

““”字符标准化“””
temp['From'] = temp['From'].str.capitalize()
temp['To'] = temp['To'].str.capitalize()

“”“删除坏数据加入整理好的数据”“”
df = df.drop('From_To', axis=1)
df = df.join(temp)
# print(df)

“”“去除多余字符”“”
df['Airline'] = df['Airline'].str.extract(
    '([a-zA-Z\s]+)', expand=False).str.strip()
print(df)
| / | FlightNumber | RecentDelays | Airline | From | To |
|---|---|---|---|---|---|
| 0 | 10045 | [23, 47] | KLM | London | Paris |
| 1 | 10055 | [] | Air | France | Madrid |
| 2 | 10065 | [24, 43, 87] | British Airways | London | Stockholm |
| 3 | 10075 | [13] | Air France | Budapest | Paris |
| 4 | 10085 | [67, 32] | Swiss Air | Brussels | London |
数据预处理
班级一部分同学的数学成绩表:
df=pd.DataFrame({‘name’:[‘Alice’,‘Bob’,‘Candy’,‘Dany’,‘Ella’,‘Frank’,‘Grace’,‘Jenny’],‘grades’:[58,83,79,65,93,45,61,88]})
但我们更加关心的是该同学是否及格,将该数学成绩按照是否>60来进行划分。
df = pd.DataFrame({'name': ['Alice', 'Bob', 'Candy', 'Dany', 'Ella',
                            'Frank', 'Grace', 'Jenny'], 'grades': [58, 83, 79, 65, 93, 45, 61, 88]})


def choice(x):
    if x > 60:
        return 1
    else:
        return 0


df.grades = pd.Series(map(lambda x: choice(x), df.grades))
df
| - | name | grades |
|---|---|---|
| 0 | Alice | 0 |
| 1 | Bob | 1 |
| 2 | Candy | 1 |
| … | … | … |
一个列为A的 DataFrame 数据df = pd.DataFrame({‘A’: [1, 2, 2, 3, 4, 5, 5, 5, 6, 7, 7]})
尝试将 A 列中连续重复的数据清除。
df = pd.DataFrame({'A': [1, 2, 2, 3, 4, 5, 5, 5, 6, 7, 7]})
df.loc[df['A'].shift() != df['A']]
| - | A |
|---|---|
| 0 | 1 |
| 1 | 2 |
| 3 | 3 |
| … | … |
有时候,DataFrame 中不同列之间的数据差距太大,需要对其进行归一化处理。 其中,Max-Min 归一化是简单而常见的一种方式,公式如下:
Y = X − X m i n X m a x − X m i n Y=\frac{X-X_{min}}{X_{max}-X_{min}} Y=Xmax−XminX−Xmin
def normalization(df):
    numerator = df.sub(df.min())
    denominator = (df.max()).sub(df.min())
    Y = numerator.div(denominator)
    return Y


df = pd.DataFrame(np.random.random(size=(5, 3)))
print(df)
normalization(df)
------------------------------
“”“
          0         1         2
0  0.470056  0.982399  0.363549
1  0.087079  0.620251  0.194063
2  0.956984  0.261238  0.605419
3  0.001150  0.817922  0.629556
4  0.326190  0.068997  0.505367
Out:
0	1	2
0	0.490572	1.000000	0.389182
1	0.089900	0.603517	0.000000
2	1.000000	0.210467	0.944577
3	0.000000	0.819930	1.000000
4	0.340059	0.000000	0.714832
”“”
数据可视化
# 第一张图:Series 折线图
import matplotlib
df = pd.Series(np.random.randn(100), index=pd.date_range('today', periods=100))
df = ts.cumsum()
df.subplot(2,2,1)
df.plot()

--------------------------------
# 第二张图:DataFrame 折线图
df = pd.DataFrame(np.random.randn(100, 4), index=ts.index,
                  columns=['A', 'B', 'C', 'D'])
df = df.cumsum()
df.subplot(2,2,4)
df.plot()

--------------------------------
# 第三张图:DataFrame 散点图
df = pd.DataFrame({"xs": [1, 5, 2, 8, 1], "ys": [4, 2, 1, 9, 6]})
df = df.cumsum()
df.subplot(2,3,5)
df.plot.scatter("xs", "ys", color='red', marker="*")

--------------------------------
# 第四张图:DataFrame 柱形图
df = pd.DataFrame({"revenue": [57, 68, 63, 71, 72, 90, 80, 62, 59, 51, 47, 52],
                   "advertising": [2.1, 1.9, 2.7, 3.0, 3.6, 3.2, 2.7, 2.4, 1.8, 1.6, 1.3, 1.9],
                   "month": range(12)
                   })

ax = df.plot.bar("month", "revenue", color="yellow")
df.subplot(2,3,8)
df.plot("month", "advertising", secondary_y=True, ax=ax)
总结
这篇博文总共用时两天,第一天把pandas百题大冲关做了2~3遍,然后睡了一觉还是很多不记得,所以今天就开始画思维导图,外加上再一边对照代码一边写博客,印象又加深了许多,其实这些语法也是pandas里面基础的语法,如果配合着其他的比如说sklearn、matplotlib等包一起的话,那么就更加有趣味性和挑战性,这里我也只是比较全面的过一遍pandas先,这篇博文相当于留给自己自备,以防以后忘了然后回过头来看看。