Lesson 04 for Plotting in R for Biologists

taoyan:R语言中文社区特约作家,伪码农,R语言爱好者,爱开源。
个人博客: https://ytlogos.github.io/
往期回顾
R语言可视化学习笔记之相关矩阵可视化包ggcorrplot
R语言学习笔记之相关性矩阵分析及其可视化
ggplot2学习笔记系列之利用ggplot2绘制误差棒及显著性标记
ggplot2学习笔记系列之主题(theme)设置
用circlize包绘制circos-plot
利用gganimate可视化R-Ladies发展情况
一篇关于国旗与奥运会奖牌的可视化笔记
利用ggseqlogo绘制seqlogo图
R语言data manipulation学习笔记之创建变量、重命名、数据融合
R语言data manipulation学习笔记之subset data
R语言可视化学习笔记之gganimate包
创建属于自己的调色板
Lesson 01 for Plotting in R for Biologists
Lesson 02&03 for Plotting in R for Biologists

上次将Lesson 02&03一起讲解完了,在Lesson 04中主要解决下面几个问题
剔除掉染色体前缀chr
对染色体进行正确排序
对数据进行过滤
对部分type重命名
加载数据
library(tidyverse)
my_data <- read.csv("Encode_HMM_data.txt", sep = "\t", header = FALSE)
head(my_data[, c(1:6)])
## V1 V2 V3 V4 V5 V6
## 1 chr1 10000 10600 15_Repetitive/CNV 0 .
## 2 chr1 10600 11137 13_Heterochrom/lo 0 .
## 3 chr1 11137 11737 8_Insulator 0 .
## 4 chr1 11737 11937 11_Weak_Txn 0 .
## 5 chr1 11937 12137 7_Weak_Enhancer 0 .
## 6 chr1 12137 14537 11_Weak_Txn 0 .
对数据部分列进行重命名
names(my_data)[1:4] <- c("chrom", "start", "stop","type")
head(my_data[, c(1:4)])
## chrom start stop type
## 1 chr1 10000 10600 15_Repetitive/CNV
## 2 chr1 10600 11137 13_Heterochrom/lo
## 3 chr1 11137 11737 8_Insulator
## 4 chr1 11737 11937 11_Weak_Txn
## 5 chr1 11937 12137 7_Weak_Enhancer
## 6 chr1 12137 14537 11_Weak_Txn
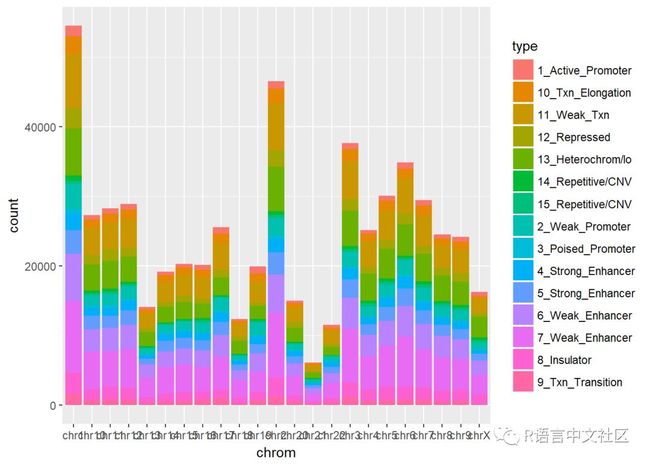
绘图
ggplot(my_data, aes(x=chrom, fill=type))+geom_bar()
数据调整
主要是针对上面提出的几个问题对数据进行调整
剔除染色体前缀chr
my_data$chrom <- factor(gsub("chr", "", my_data$chrom))
ggplot(my_data, aes(x=chrom, fill=type))+geom_bar()

对染色体进行排序
这个关于人类的基因组数据,所以染色体顺序应该是1:22,X,Y。
my_data$chrom <- factor(my_data$chrom, levels = c(seq(1:22), "X", "Y"))
ggplot(my_data, aes(x=chrom, fill=type))+geom_bar()
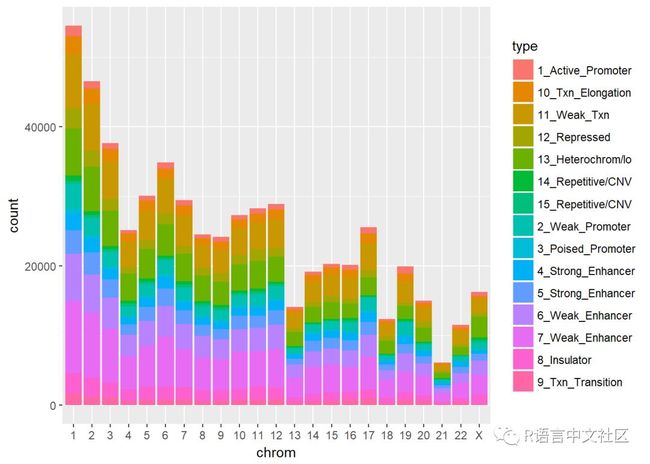
这下看起来相对好一点
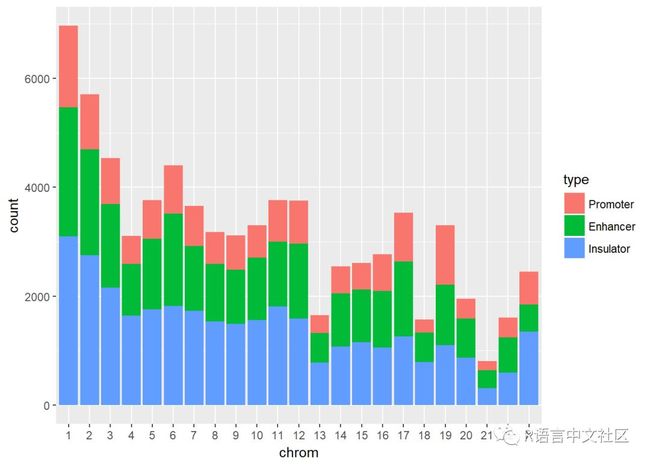
选取type
只选取我们感兴趣的type进行可视化
my_data <- my_data[my_data$type %in% c("1_Active_Promoter", "4_Strong_Enhancer", "8_Insulator"), ]
对选取的type进行重命名
library(plyr)
my_data$type <- revalue(my_data$type,c("1_Active_Promoter"="Promoter","4_Strong_Enhancer"="Enhancer","8_Insulator"="Insulator"))
ggplot(my_data, aes(x=chrom, fill=type))+geom_bar()
SessionInfo
sessionInfo()
## R version 3.4.3 (2017-11-30)
## Platform: x86_64-w64-mingw32/x64 (64-bit)
## Running under: Windows 10 x64 (build 16299)
##
## Matrix products: default
##
## locale:
## [1] LC_COLLATE=Chinese (Simplified)_China.936
## [2] LC_CTYPE=Chinese (Simplified)_China.936
## [3] LC_MONETARY=Chinese (Simplified)_China.936
## [4] LC_NUMERIC=C
## [5] LC_TIME=Chinese (Simplified)_China.936
##
## attached base packages:
## [1] stats graphics grDevices utils datasets methods base
##
## other attached packages:
## [1] plyr_1.8.4 forcats_0.2.0 stringr_1.2.0
## [4] dplyr_0.7.4 purrr_0.2.4 readr_1.1.1
## [7] tidyr_0.7.2 tibble_1.4.2 ggplot2_2.2.1.9000
## [10] tidyverse_1.2.1
##
## loaded via a namespace (and not attached):
## [1] Rcpp_0.12.15 cellranger_1.1.0 pillar_1.1.0
## [4] compiler_3.4.3 bindr_0.1 tools_3.4.3
## [7] digest_0.6.14 lubridate_1.7.1 jsonlite_1.5
## [10] evaluate_0.10.1 nlme_3.1-131 gtable_0.2.0
## [13] lattice_0.20-35 pkgconfig_2.0.1 rlang_0.1.6
## [16] psych_1.7.8 cli_1.0.0 rstudioapi_0.7
## [19] yaml_2.1.16 parallel_3.4.3 haven_1.1.1
## [22] bindrcpp_0.2 xml2_1.2.0 httr_1.3.1
## [25] knitr_1.18 hms_0.4.1 rprojroot_1.3-2
## [28] grid_3.4.3 glue_1.2.0 R6_2.2.2
## [31] readxl_1.0.0 foreign_0.8-69 rmarkdown_1.8
## [34] modelr_0.1.1 reshape2_1.4.3 magrittr_1.5
## [37] backports_1.1.2 scales_0.5.0.9000 htmltools_0.3.6
## [40] rvest_0.3.2 assertthat_0.2.0 mnormt_1.5-5
## [43] colorspace_1.3-2 labeling_0.3 stringi_1.1.6
## [46] lazyeval_0.2.1 munsell_0.4.3 broom_0.4.3
2017年R语言发展报告(国内)
R语言中文社区历史文章整理(作者篇)
R语言中文社区历史文章整理(类型篇)

公众号后台回复关键字即可学习
回复 R R语言快速入门及数据挖掘
回复 Kaggle案例 Kaggle十大案例精讲(连载中)
回复 文本挖掘 手把手教你做文本挖掘
回复 可视化 R语言可视化在商务场景中的应用
回复 大数据 大数据系列免费视频教程
回复 量化投资 张丹教你如何用R语言量化投资
回复 用户画像 京东大数据,揭秘用户画像
回复 数据挖掘 常用数据挖掘算法原理解释与应用
回复 机器学习 人工智能系列之机器学习与实践
回复 爬虫 R语言爬虫实战案例分享